Market Overview
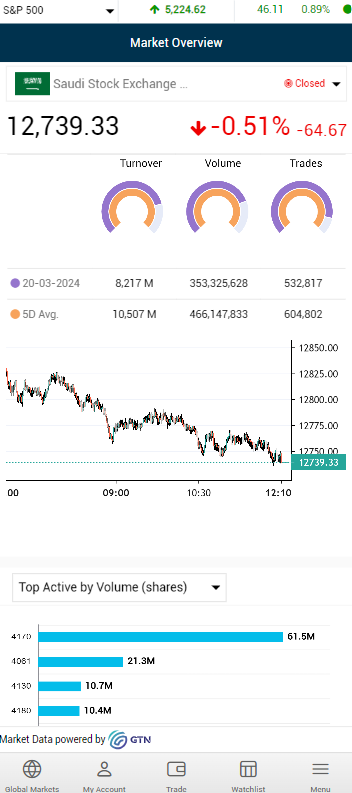
This screen presents the various aggregate performance metrics of the market (exchange) in clear and concise graphical dashboards.
- To access this feature simply tap on “Markets” from the main menu, then select “Market Overview“.
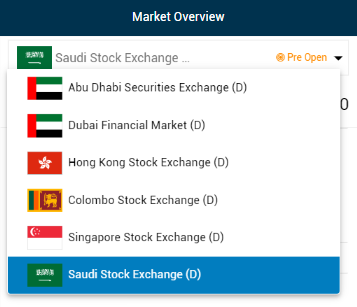
- Select an exchange you wish to analyze from the dropdown menu.
- Selecting an exchange will load the dashboard consisting of the turnover, volume, trades, and chart figures along with the following components.
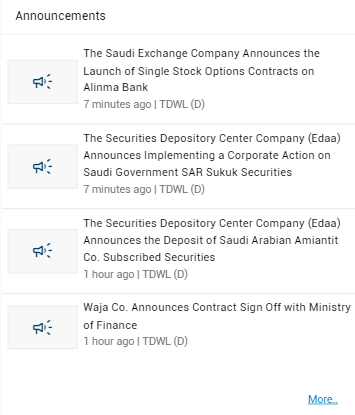
- Latest News & Announcements for the selected exchange.
- Note: Clicking on the
 'more' icon located at the corner of the price, or news & announcements widgets will redirect to the top stocks or news and announcements pages respectively.

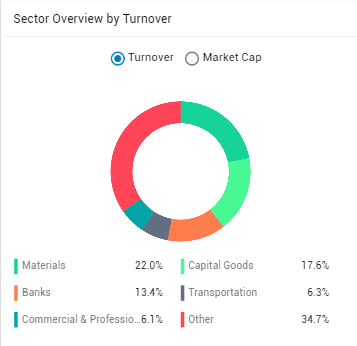
- A Sector Overview can be viewed by Turnover or by Market Capitalization.
- The sector overview provides you with a graphical overview of the performance of the selected exchange by its industrial sectors (i.e. Financial Services, Telecoms, etc.) Sector performance can be assessed by turnover or by market capitalization; choose your preference and the chart with automatically update.
- A summarized view of the following indicators. The selected/displayed indicator can be changed using the second dropdown menu.
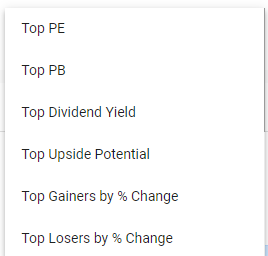
- Top PE
- Top PB
- Top Dividend Yield
- Top Upside Potential
- Top Gainers by % Change
- Top Losers by % Change
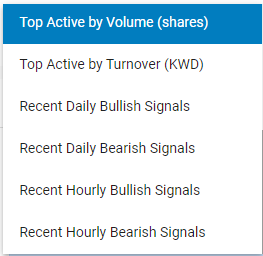
- Top Active by Volume
- Top Active by Turnover
- Recent Bullish Signals
- Recent Bearish Signals
- Recent Hourly Bullish Signals
- Recent Hourly Bearish Signals