Trading Signals
The signals provided within this application are provided by 'autochartist' in real-time. Autochartist is a firm that produces highly sophisticated pattern recognition software to identify market opportunities and threats.
Think of signals as 'triggers' (or notifications) to buy or sell a stock. These triggers are created by traders or by machine-learning algorithms based on the analysis of technical indicators and patterns (i.e. support & resistance, oscillators, and more). For instance, a chart pattern could alert traders that a stock is reaching its support or resistance price level. This notification or trigger could then serve as an early warning or an emerging opportunity to investors.
- Select the Analytics tab from the side menu, then select 'Trading Signals'.
- Next, click on the
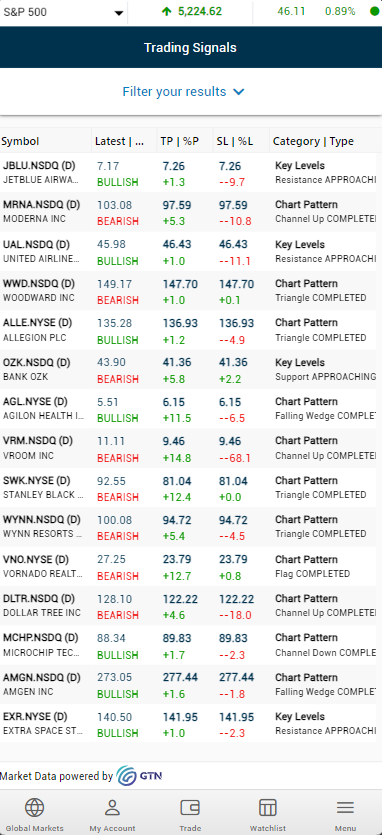
 'filter your results' link.
- Select from the various filters available and click on the 'Screen'
 button.
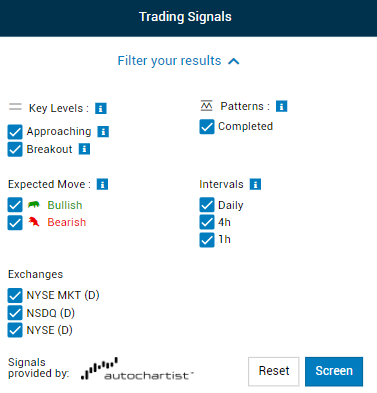
- This will then filter the table displaying only the stocks that match the filter criteria specified.
- Clicking on a row (i.e. a signal for a stock) will redirect to the Tech Analysis tab of the relevant instrument profile.
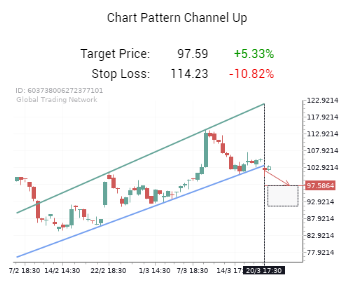
- An example of a "flag" chart pattern in the candlestick chart.