Watchlist
The application uses 'watchlists' to display the symbols in a particular exchange or a user-created list of symbols. These lists can be used to buy/sell stocks via the app or to monitor/keep track of their performance attributes. This section will provide a walkthrough of core watchlist functionalities; i.e. on how to create and monitor watchlists containing stock symbols.
- Accessing Watchlists
- Creating a Watchlist
- Customizing Watchlist Options
- Viewing Options for Watchlists
- Watchlist Indicators
- Click on the
 icon in the workspace. Select the Markets tab from the side menu, then click on Watchlist.
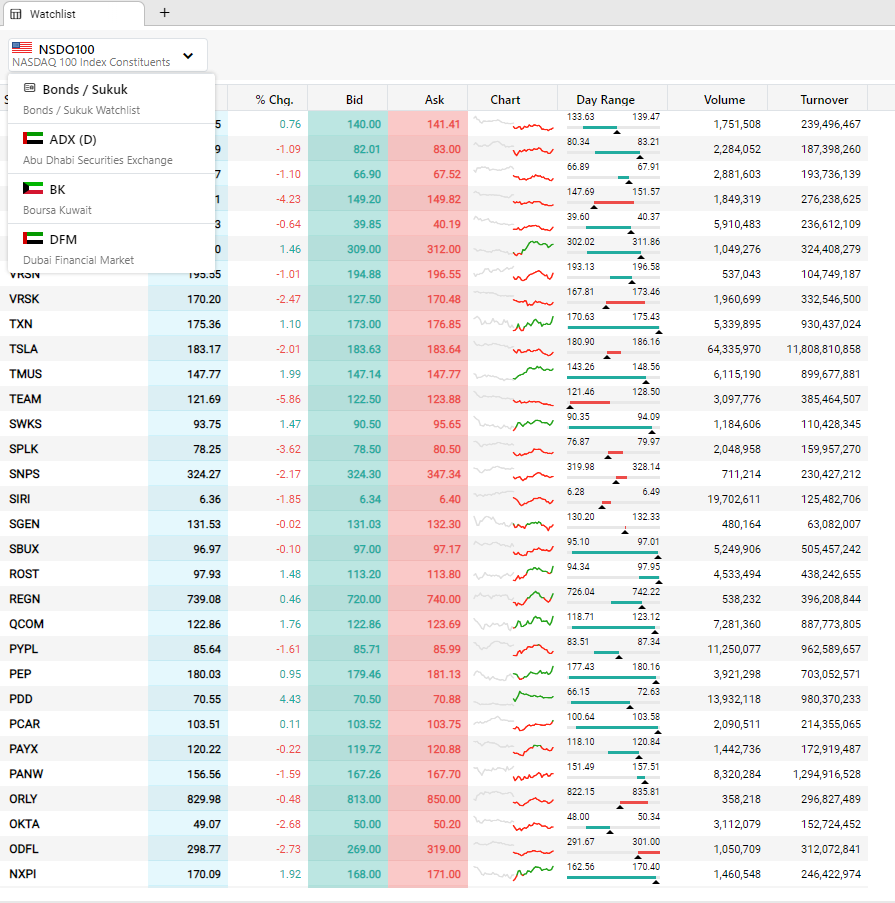
- Click on the dropdown located at the top right-hand corner of the widget and select a watchlist.
- This can be an entire exchange (i.e. NSDQ, DFM, etc.) or a user-created 'Custom Watchlist'.
- Right-clicking on a symbol within any watch list opens a context menu containing options to buy/sell, view the stock profile, open an option chain, get a detailed quote or, view its chart details.
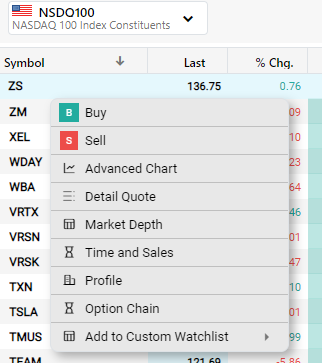
Note: Depend on the level of feed, regional and international symbols, right click options can be varied.
To Create a Custom Watchlist (with user-specified symbols)
This section will guide you through the process of creating a list comprised of user-selected symbols. This list can then be used to buy/ sell symbols or to monitor their performance.
- Click on the
 in the top right corner and click on the
  New Watchlist icon to create a new watchlist.
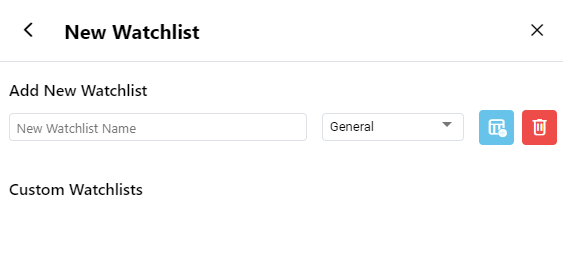
- Type in a new name for the watchlist in the 'Add' field, then press the
 icon next to it. (Watchlists also can be edited/deleted from the same window).
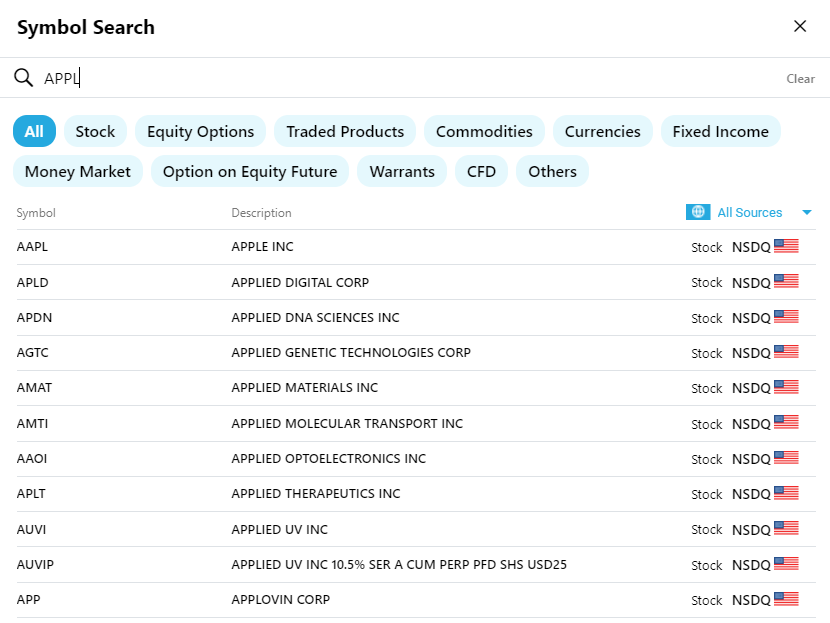
- To populate the newly created watchlist with symbols, ensure the new watchlist is selected from the dropdown then type in the symbol name in the search bar.
- Select the symbol as it appears in the autocomplete list while typing.
Customizing Watchlist Settings
- Click on the
 and select Manage Columns.
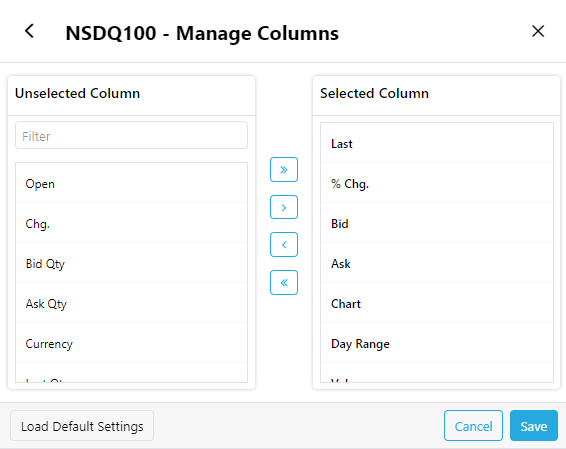
- Select the columns you wish to add from the Left column by clicking the ">" button. If you wish to deselect an already added column you can do so by clicking "<".
- Click on Save to confirm your changes.
- You may revert to the default settings at any time by clicking the 'Load Default Settings' button at the bottom left-hand corner of the window.
Note: This feature is only available for classic watchlist view.
Viewing Options for Watchlists
Maximizing/ Minimizing the watchlist widget
- Click on the maximize
 icon at the top-right-hand corner of the widget to Maximize the watchlist widget (i.e. full-screen view).
- Click on the minimize
 icon at the bottom-left-hand corner of the widget to Minimize the watchlist widget (while in a maximized state).
Table view options
- The following viewing options are available for the watchlist table.
- To change the view of the watchlist table, click on settings and simply select your preferred view from the Watchlist View.
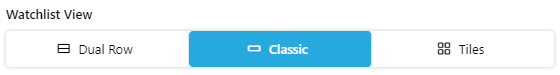
- Classic – Displays the symbol details in a simple and cleaner manner - clicking watchlist settings allows you to add or remove columns according to preference.
- Dual Row – Displays symbol details in a more descriptive manner.
- Tiles - Displays symbol details in a simple and clearer manner.
- To view of the Company Logo & Country Flag of the symbols, click on settings and select your preferred option from Country Flag & Company Logo.
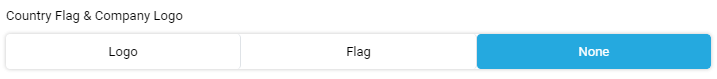
- Logo – Displays the Company Logo of the symbol.
- Flag – Displays the Country Flag of the symbol.
- None - Displays only the symbol name.
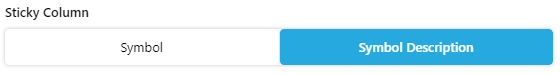
- Under the classic watchlist view, you can either view the Symbol or Symbol Description in the Sticky Column.
In certain exchanges, color-coded flags are displayed next to a symbol on the watchlist to denote any of the following events.
 A Yellow flag next to the symbol indicates 20% to less than 35% of accumulated losses.
 A Red flag next to the symbol indicates 50% or more of accumulated losses.
 An Orange flag next to the symbol indicates 35% to less than 50% of accumulated losses.
 This flag indicates a 52-week high value, reaching high value of that particular symbol.
 This flag indicates a 52-week low value, reaching low value of that particular symbol.
 This indicates that there are important announcements for the selected symbol (these can be viewed by clicking on the flag).
 This flag indicates that overnight trading is enabled for that particular symbol.