Portfolio Dashboard
The Portfolio Dashboard provides a real-time graphical overview of the portfolio and its performance; i.e. the profit/ loss generated from the securities (i.e. stocks) contained in one portfolio. Portfolio performance is analyzed from multiple perspectives including fundamentals (like financial ratios). It also provides a live real-time valuation of the user's securities based on their current market value, and their initial purchase price.

- You can select the portfolio (s) you wish to analyze from the dropdown at the top of the screen (selecting 'All' will analyze the performance of all Portfolios and their constituent securities as a whole).
- Selecting a Portfolio will automatically load the performance metrics associated with it.
- You may also select the preferred currency and decimal place options from the relevant drop-downs.
- Click on the
 button to maximize the Portfolio dashboard (i.e. enter into a full-screen view). Press
  button to minimize/ return to the previous widget view.
 - Click on the
 button to customize the column settings as you prefer.
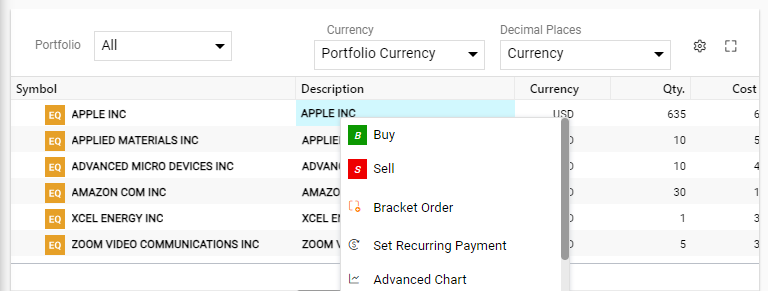
By right-clicking on a symbol in the portfolio, you can access a range of features, including Buy, Sell, Bracket Order, Set Recurring Payment, Advance Chart, etc.
The portfolio interface contains multiple graphical widgets providing an overview of the following portfolio performance metrics.
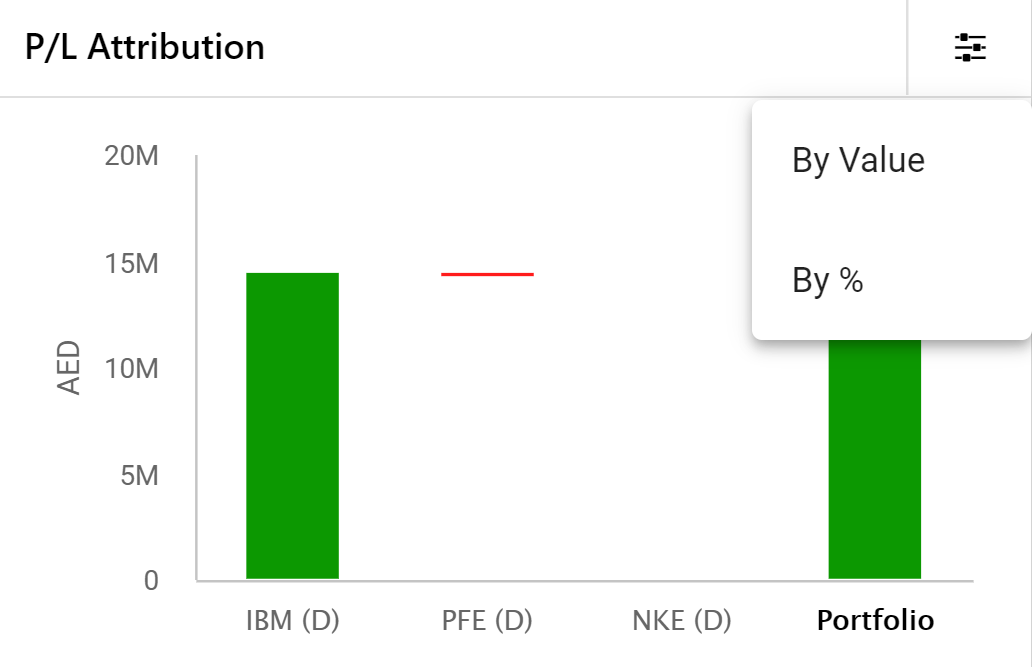
- P/L Attribution – Represents the profit and loss of each symbol in the portfolio profit. Click
 to view the results by “%” and by “value“.
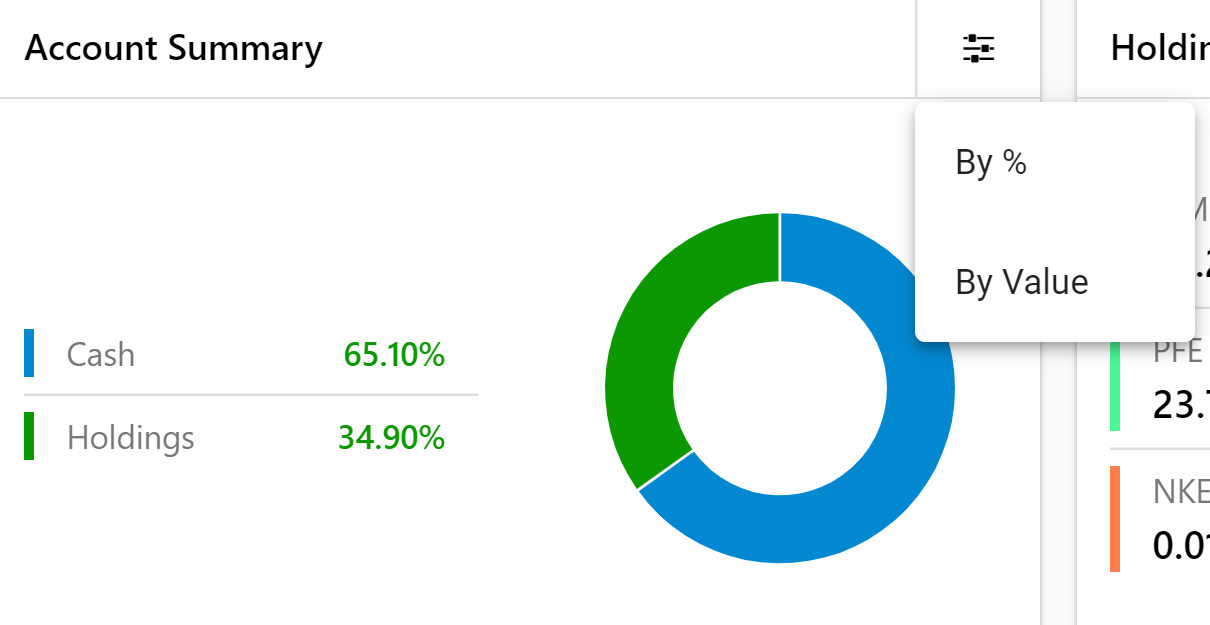
- Account Summary – This graphical dashboard represents the amount of cash in the user's account relative to the total value of their holdings. Click settings to view the results by “%” and by “value“.
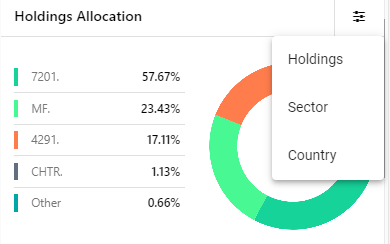
- Holding Allocations – This graphical dashboard widget represents the percentage value of holdings. Click settings to view holdings allocations by Industry or Country (you may switch back to the default Holdings view from another view).
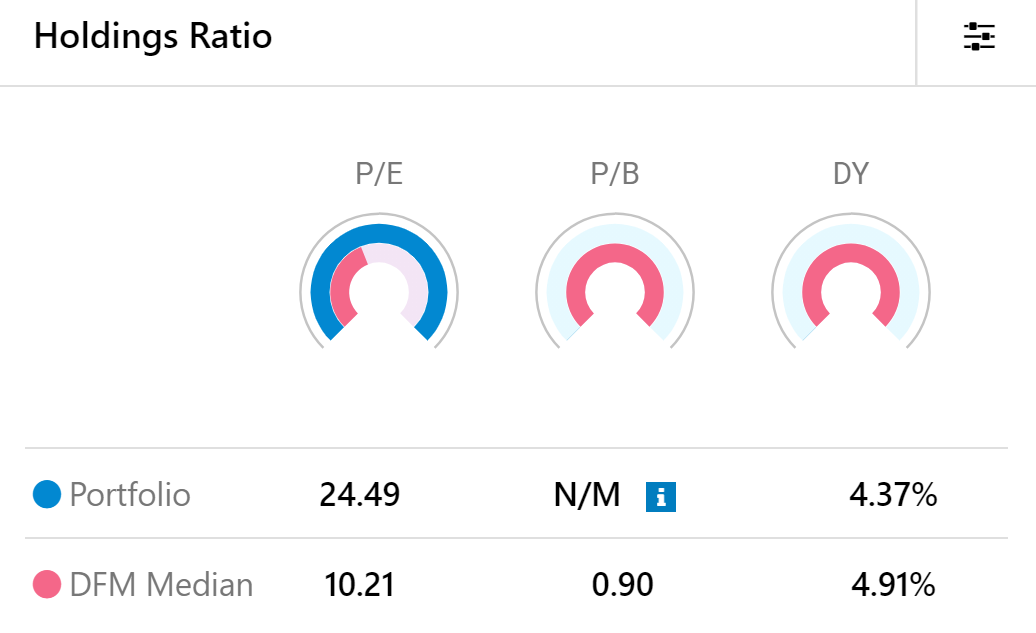
- Holding Ratios – This graphical dashboard represents the weighted Price to Earnings (PE), Price to Book (PB) ratios, and Dividend Yield (DY) of the user's portfolio compared to the market averages.
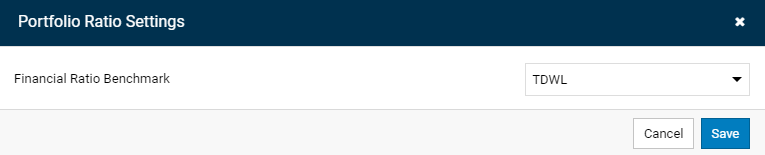
- Click to view options for Financial Ratio Benchmarks.
- To select a different reference exchange for the median values (displayed in the Holdings ratio dashboard), select one from the dropdown, and click Save. These options are the exchanges to which your portfolio will be benchmarked against (in the median field).
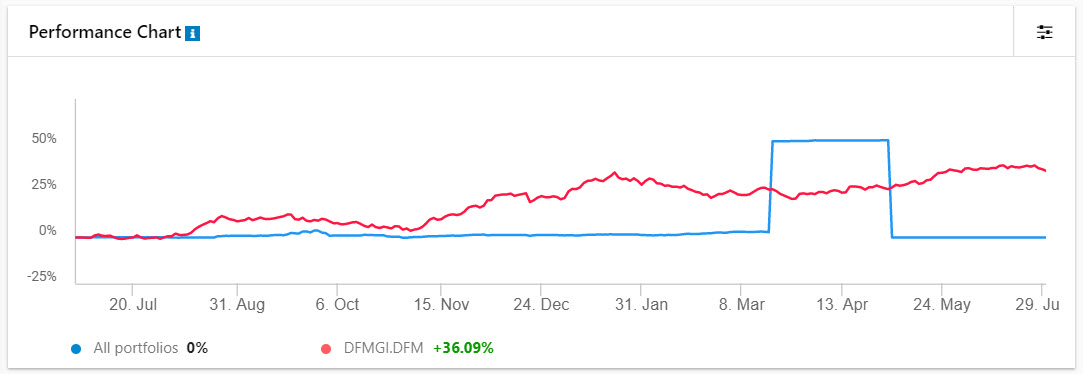
- Performance Chart – This graphical chart widget plots the performance of the user's portfolios compared to the market average. You can hover over a point in the graph to get an accurate value of the performance at that point. Click to select the desired default period for this chart.
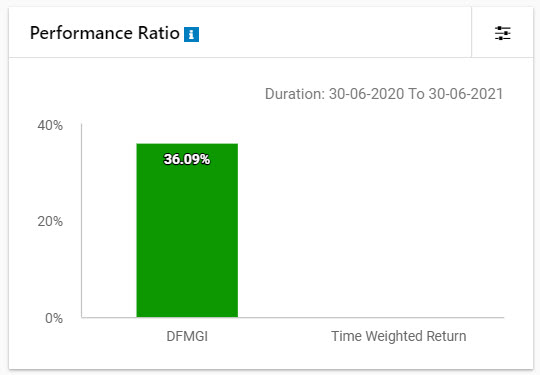
- Performance Ratio – Demonstrates performance ratio within specific a duration. Click to select the desired default period for the data to load in the chart.
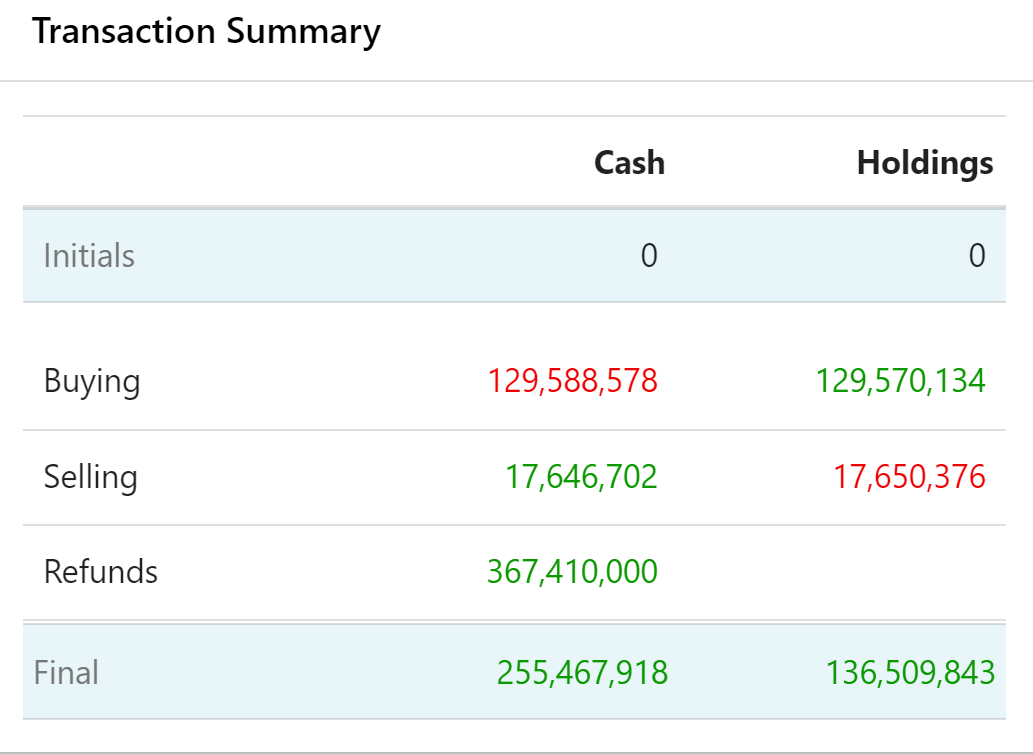
- Transaction Summary – Summarizes the user's transactions and provides aggregate performance metrics of cash and holdings in buy/ sell or refund transactions.
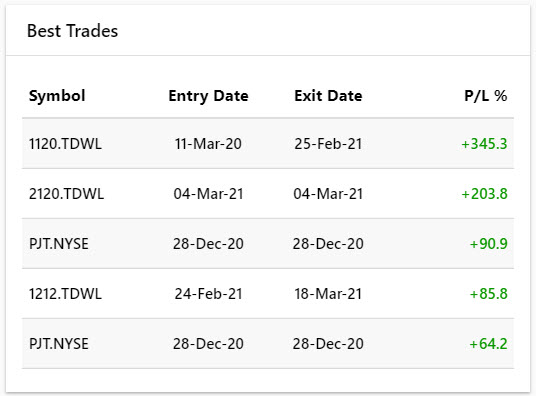
- Best Trades – Presents the symbol details of the best trades (where PL % is positive) in the user's portfolio.
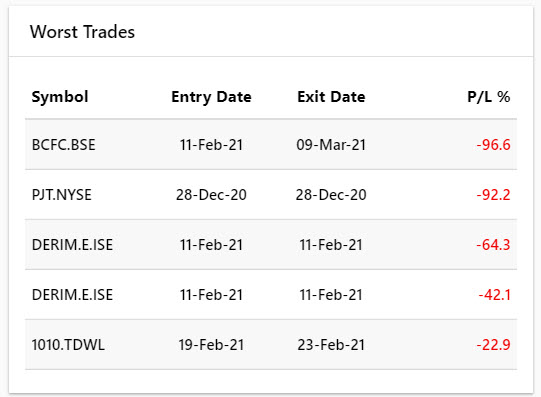
- Worst Trades – Presents the symbol details of the worst trades (where PL % is negative) in the user's portfolio.