Top Stocks
The Top Stocks feature provides a quick glance at the Top Gainers and Losers in the selected market. These are presented in graphical dashboards which helps investors navigate the ever-volatile market with ease to make smart decisions. Investors could use this data to recognize patterns in price movements of the stocks they own or are interested in purchasing.
- Click on the Analytics tab from the side menu, then select Top Stocks.
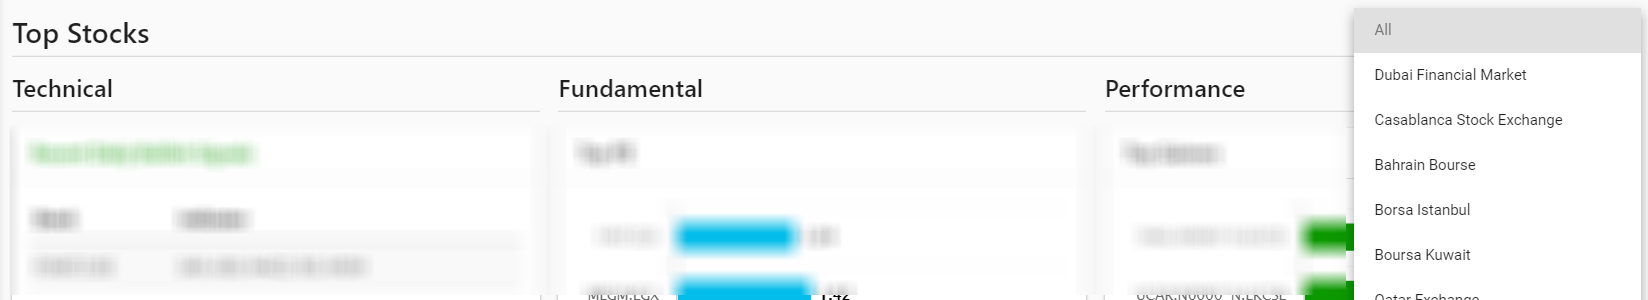
- Select the exchange of your choice from the drop-down located at the top right-hand corner of the window.
- This will then display a set of bar charts which are grouped by Technical, Fundamental, and Performance indicators.
- Displays the top bullish and bearish symbols for the selected exchange (learn more on technical analysis here).
- A Bullish Signal indicates increasing investor confidence in the symbol as demonstrated by an upward trajectory in the price of the stock.
- A Bearish Signal indicates decreasing investor confidence in the symbol as demonstrated by a downward trajectory in the price of the stock.
- These are termed 'fundamentals' as they are critical measures of a firm's financial health and sustainability. They analyze the financial strength of a company over the short and long term (learn more on financial analysis here).
- This section displays the top symbols according to the following ratios (i.e. Top symbols by PE ratio, PB ratio, and dividend yield).
- Price to Earnings (PE) Ratio: The Price to Earnings (PE) ratio compares a company's current stock price to its earnings per share (EPS). This serves as a measure of whether a stock is undervalued or overvalued (This can be confirmed further with the PB ratio). A lower PE ratio is considered better as it indicates the stock veers more towards being undervalued than overvalued.
- Price to Book (PB) Ratio: The Price to Book (PB) ratio compares a company's current stock price to the quarterly book value per share. This can be used as a confirmation of a PE ratio, as a PB ratio can help investors avoid companies that are overvalued. A lower PB ratio is considered better as it indicates the stock veers more towards being undervalued than overvalued.
- A PB ratio value of 1.0 indicates the company's share price is proportional to the value of its assets on the balance sheet. A low PB ratio value (below 1.0) could be an indication that a company's shares are trading at a lower price relative to the value of its total net assets on the balance sheet. In contrast, a high PB value (above 1.0) could be an indication that a company is overvalued as is trading way above the value of its total assets value on its balance sheet.
- The PB ratio could inflate or deflate due to factors in the company's business environment. For instance, good or bad news regarding the company in the press (i.e. news sentiment), or management actions can affect the PB ratio. Larger gaps between PB ratio and Return on Equity (ROE) are usually a red flag to investors to avoid a stock purchase.
- Upside Potential: This is the amount by which the price of a security may increase.
- Top gainers by % change: This represents the symbols that have experienced percentage change increases in their value. This refers to an increase in the stock price value compared to the previous trading day expressed as a percentage.
- Top Losers by % change: This represents the symbols that have experienced percentage change decreases in their value. This refers to a decrease in the stock price value compared to the previous trading day expressed as a percentage.
- Top Active by Volume (shares): This represents the active symbols that have the highest volume.
- Top Active by Turnover: This represents the active symbols that have the highest turnover.