Working with Charts
The new charting module by TradingView acts as the central analytics tool within the application that helps users analyze, compare and predict the price movements of stocks, indices, or other financial securities based on reliable past and current data. Charts provide an easy-to-view graphical representation of a security’s performance (i.e. price) over a period of time. The charting component of the app contains multiple customization options and even supports advanced analytics functions such as technical indicator based analysis.
- Click on the Analytics tab from the side menu, then select Charts to get started.
- This guide provides a walkthrough on how to utilize the basic and advanced charting features in the application.
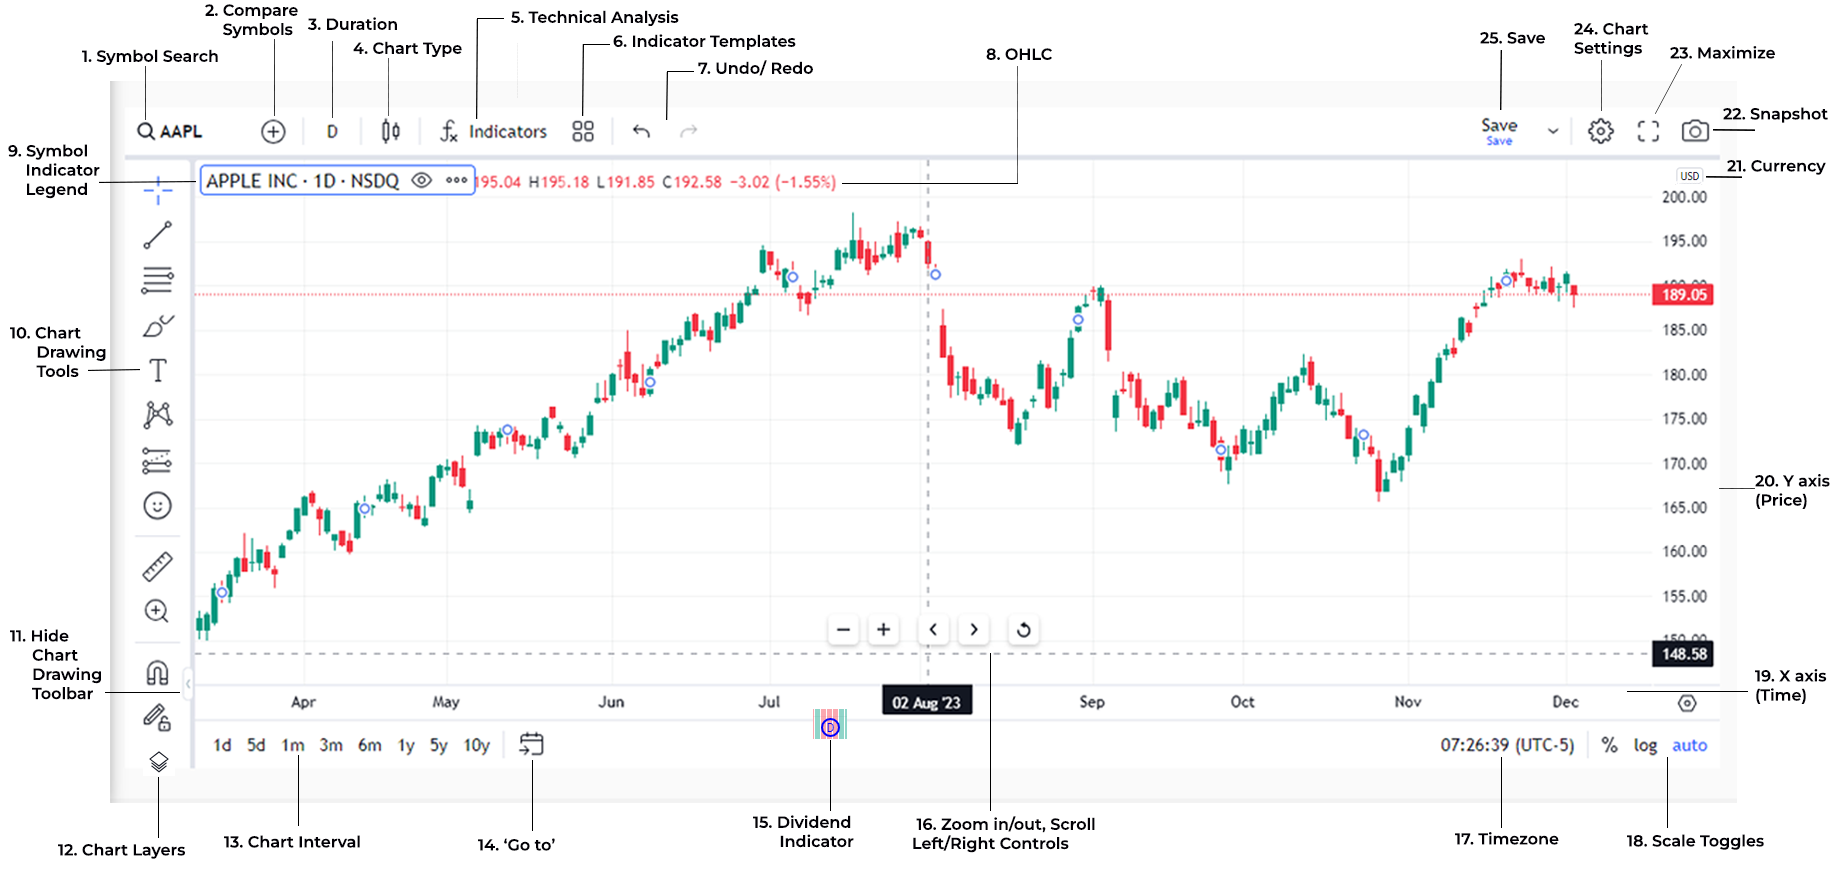
1. Symbol Search
- Click on the search box and start typing the name of the symbol or index you wish to view the chart/index of, then click on the symbol/index name when it appears in the autocomplete list.
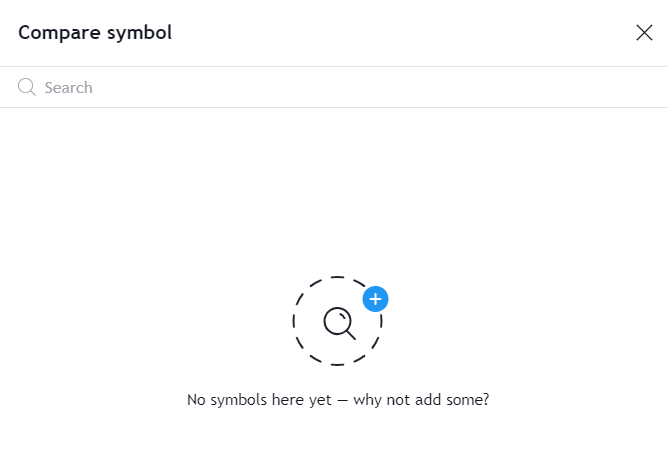
2. Compare Symbols
- Clicking on the
 button will open a search box allowing you to add another symbol or index you wish to compare the first one with, type in the symbol/index name, and select it when it appears in the autocomplete list.
3. Chart Duration
- The app supports time frame options ranging from 1 minute to 1 month in duration.
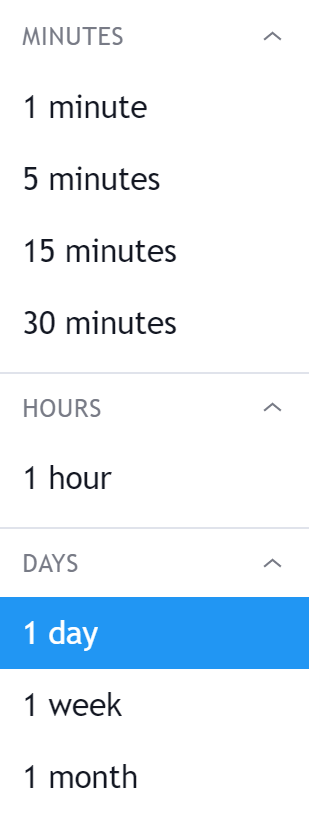
- You may select from several available chart duration options depending on the scope of your analysis; these include, 1minute, 5 minutes, 15 minutes, 30 minutes, 1 hour, 1 week, 1 month pertaining to the selected symbol/index.
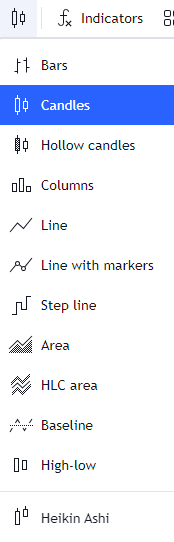
4. Chart Type
- The charting module now contains support for a range of different chart types such as the following types (pictured).
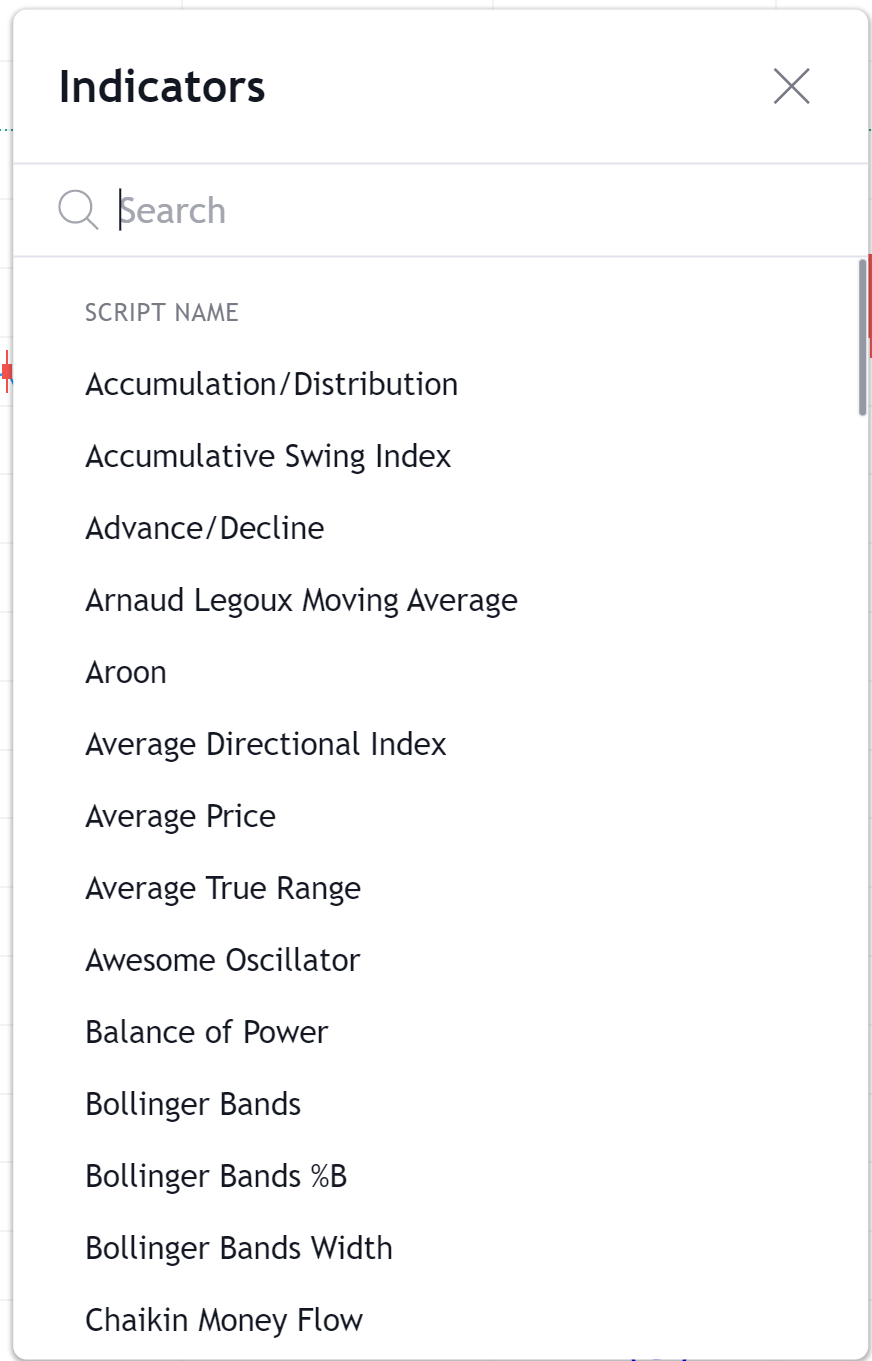
5. Technical Analysis Indicators
- For an in-depth look at technical indicators, please see section titled "Analysis with Indicators, Strategies, and Patterns".
- Clicking on the Indicators icon will open a list with a range of technical analysis indicators that can be added to the chart view as an overlay. Simply select an indicator of your choice and it will be added to the chart as an overlay.
- To hide an indicator, simply mouseover the indicator card at the corner of the chart and select the 'remove'
 button.
6. Indicator Templates
- Indicator templates can be saved using this feature.
7. Undo/ Redo
- Changes made such as drawings and overlay elements can be
 undone or
  redone according to user preference.
8. OHLC and Volume Information
- This refers to the “Open, High, Low, and Close” values for the selected stock symbol. These values will automatically update when the chart duration is changed.
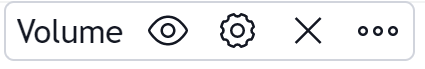
- Note that the volume chart will be displayed below the chart/ graph for the symbol if enabled from the Indicators dropdown.
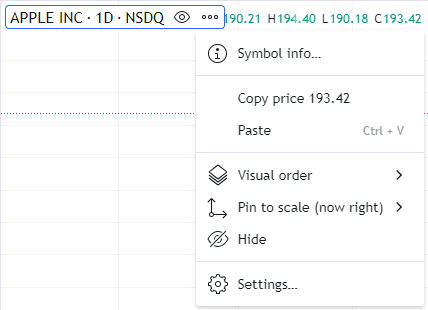
9. Symbol Indicator Legend
- The chart legend section indicates the elements (symbols, indicators) that are being displayed in the chart view at a given time with different colors. For instance, if multiple symbols are being compared on the same chart, each symbol will receive its own color.
- Mouseover the symbol indicator card and press
 to discover the following symbol options menu.
- Click on the
 icon to hide/ or show the symbol chart.
- Clicking on the icon and selecting Symbol Info will open up a dialog box containing basic stock details.
- 'Visual Order' options such as Bring to Front, Send to Back, Bring Forward, or Send Backward will control the precedence order of the symbol chart relative to the other elements (i.e. indicators, drawings, etc.) on the chart window.
 'Pin to Scale' options will control the relative scaling of the chart according to the selected option such as fullscreen, left scale, or right scale.
10. Chart Drawing Tools
- The application supports a range of analytical drawing tools which can be used to annotate and illustrate the graph according to the user's requirement. Click here to learn about these in more detail.
11. Hide Chart Drawing Toolbar
- Selecting this button will hide the chart drawing tools, thus giving the chart elements more space.
12. Chart Layers
- A chart can contain multiple objects or layers at once (i.e., for instance, two symbols could be compared).
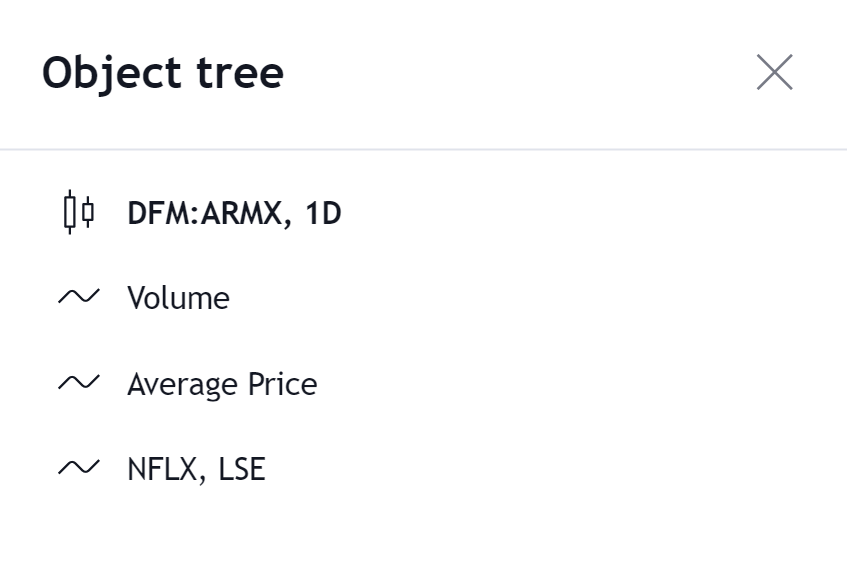
- The object tree or chart layer selector allows you to show/ hide different layers and objects of the chart and to customize their view.
13. Chart Interval
- You may select a preferred interval option that determines the time points (units of time on the X-axis) that the chart values will be displayed to.
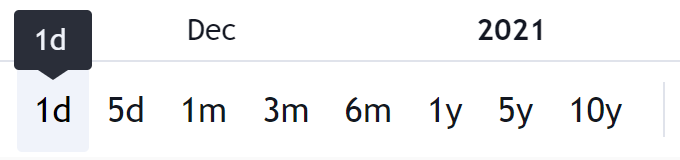
- The available interval options will vary based on the selected duration.
- For instance, if 1 Day is selected as the Chart Duration, then the available options will be 1 and 5-minute intervals. Whereas if multiple years are selected as the Chart Duration, then the available options will be 1 day, 1 week, and 1-month intervals.
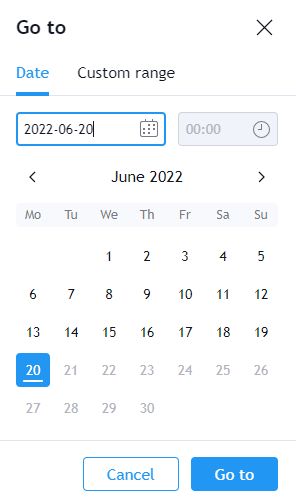
14. ‘Go to’
- Select this button to ‘go to’ a specific point in time of the selected symbol’s chart data.
- Select the preferred date and time from the date & time picker dropdowns then press the > button and the chart view will navigate to the point specified.
15. Dividend Indicator
- This indicates the date at which a dividend was paid out by the selected company (stock symbol).
16. Zoom in/out, Scroll Left/ Right controls
- Click (+) to zoom in and (-) zoom out and (<) to scroll left and (>) to scroll right.
17. Exchange Time/Timezone
- By default, this field indicates the local time of the exchange of the symbol selected. For instance, if the chart is displaying the performance of AMZN, which is in the Nasdaq exchange, then the time in the US East Coast (ET) will be displayed in the field.
- This field can also be changed to display any timezone in the world by clicking on the field, and then selecting the preferred timezone from the menu.

- Note: In the event multiple symbols from different time zones are being compared, by default, the timezone of the base symbol will be displayed in this field.
18. Scale Toggles
- The following buttons control the scale setting for the Y-axis for the selected symbol (s).
- Auto (Linear scale)
- Log (Logarithmic scale)
- % (Percentage scale)
- Further scale options can be selected from the following locations:
- Chart Settings > Scale Settings
- Clicking the
 located alongside the Y-axis. This menu is specific to the symbols added to the chart, if multiple symbols are added, there will be a
  selector for each symbol on the chart.
19. X-axis (horizontal axis)
- Represents the time scale. This range can be expanded and compressed by clicking and dragging the mouse pointer over the values.
20. Y-axis (vertical axis)
- Represents the price scale. This range can be expanded and compressed by clicking and dragging the mouse pointer over the values.
21. Currency
- This indicates the currency of the Y-axis in which stock prices are represented.
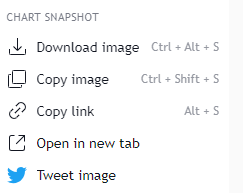
22. Snapshot
- To take a snapshot/ screenshot of the graph at any point in time and view press the snapshot button.
- To quickly save the image click on the 'Download Image' button in the prompt.
- The snapshot image is automatically uploaded to the trading view server and can be viewed by copying the URL and navigating to it by pasting and entering it in the URL bar of the browser.
- You may also tweet an image of the snapshot to your Twitter account.
23. Maximize
- This would expand the chart area to fill the entire screen.
24. Chart Settings
- This gives you access to a range of advanced customization options. Click here to learn about these in detail.
- Symbol settings: controls the color options of multiple chart elements such as the candlestick elements, and more.
- Status Line: controls options such as OHLC values, indicator labels, background color of status lines, and more.
- Scales: controls options related to price, indicator, value, and date labels.
- Canvas: controls for customizing color of chart background, crosshair, scale & grid lines, text size, and more.
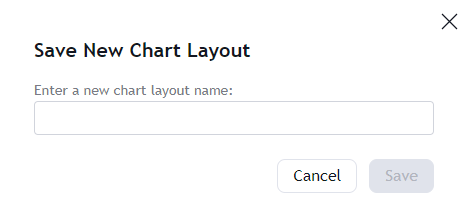
25. Save
- New Chart Layouts can be saved using this feature.