Chart Settings
- Click on the
 icon in the top right corner of the chart window to access chart settings.
Symbol Settings
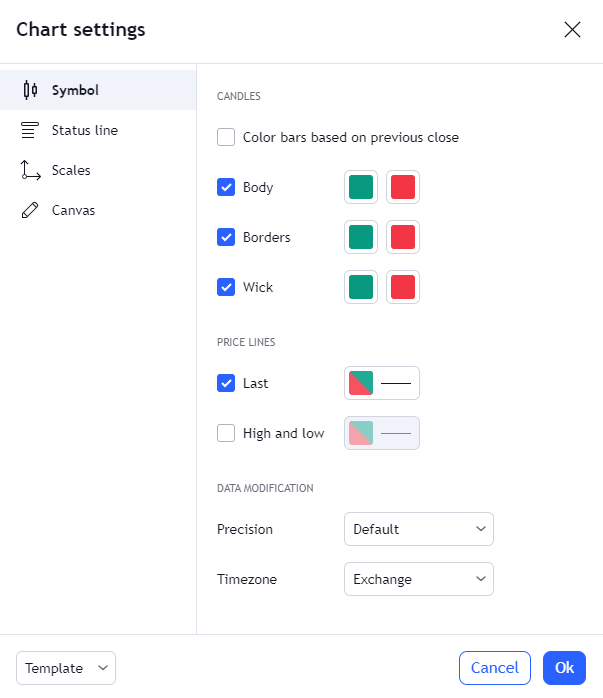
- Color bars based on Previous Close
- Selecting this checkbox will change the colors of the candlesticks based on the stock’s previous close value (i.e. positive or negative).
- Color sections: Select a preferred color scheme from the color picker for the following chart elements.
- Body
- Borders
- Wick (of candlestick)
- Last price line
- High and low price lines
- This checkbox controls whether the high and low price lines for the selected symbol are displayed as an overlay on the chart.
- Precision
- Choose how precise (accurate) you want the chart values to be from the dropdown. This setting will also change the overall pattern of the graph.
- Timezone
- This setting refers to the timezone that is displayed at the bottom of the chart view. Select a preferred timezone from the dropdown. By default, the timezone is set to the time of the exchange of the selected symbol.
Status Line
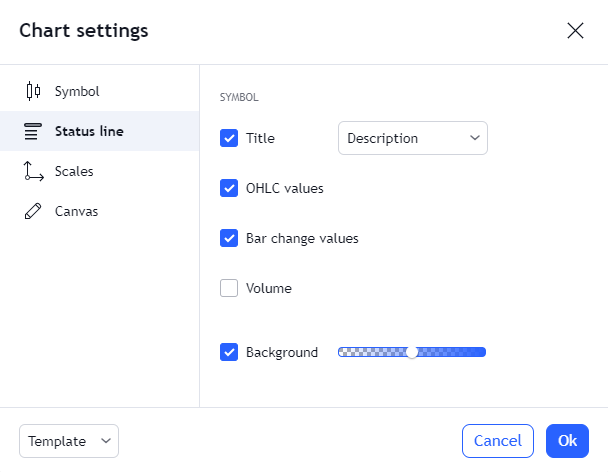
- Title
- OHLC values
- This checkbox controls whether the OHLC (Open, High, Low, Close) values for the selected symbol are displayed at the top of the chart view.
- Bar Change Values
- Volume
- Background
Scale Settings
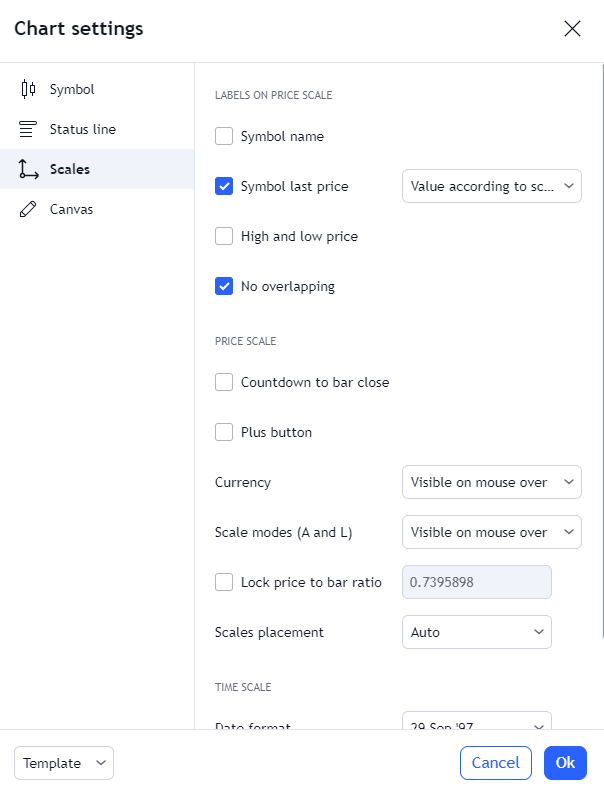
- Symbol Name
- Symbol Last Price
- High and low price
- No Overlapping
- Countdown To Bar Close
- Plus button
- Currency
- Scale models
- Lock Price To Bar Ratio
- Scales Placement
- Date Format
- Time hours format
Canvas
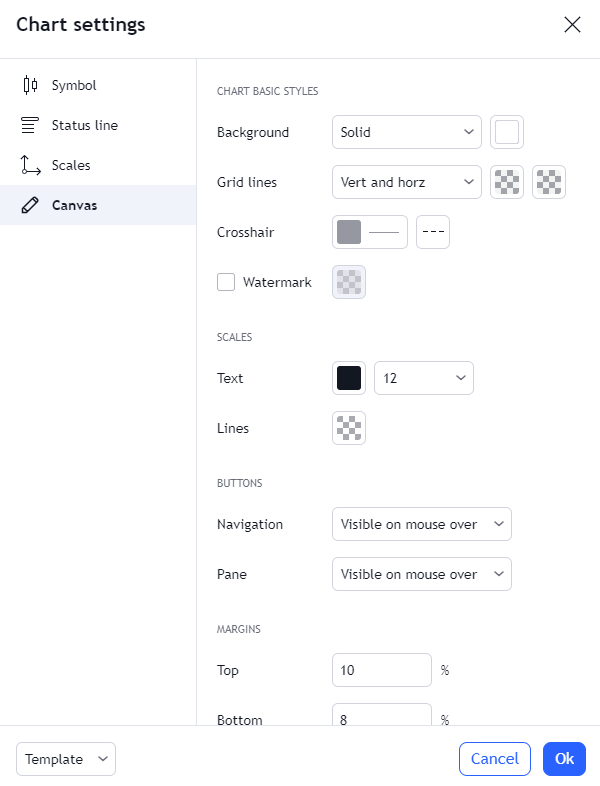
- Background
- Vert Grid Lines
- Horz Grid Lines
- Crosshair
- Watermark
- Scales Text
- Scales Lines
- Navigation Buttons
- Pane Buttons
- Top Margin
- Bottom Margin
- Right Margin