Instrument Profile
The Instrument Profile provides an in-depth look at a stock's performance attributes from different perspectives. Analyzing the variety of performance metrics, fundamentals, patterns, and technical indicators contained here can help traders create a snapshot of the performance of the stock/ security and ultimately help them in making smart, informed investment decisions.
- Go to the 'Analytics' tab in the side menu, select 'Instrument Profile', then search for a stock and select it from the autocomplete list.
- Click here to learn more on how to access an Instrument Profile.
Analyzing the Components
The tabs available in the Stock Profile would differ based on the type of symbol.
Please note that for symbols in some exchanges (I.e. stocks in the NYSE/ NASDAQ) the following tabs will be available in addition to the ones listed above.
- Option Chain
- News Sentiment
- Tech Analysis
- Analysts View
- Financial Ratios
- Peer Companies
- Instrument Profile
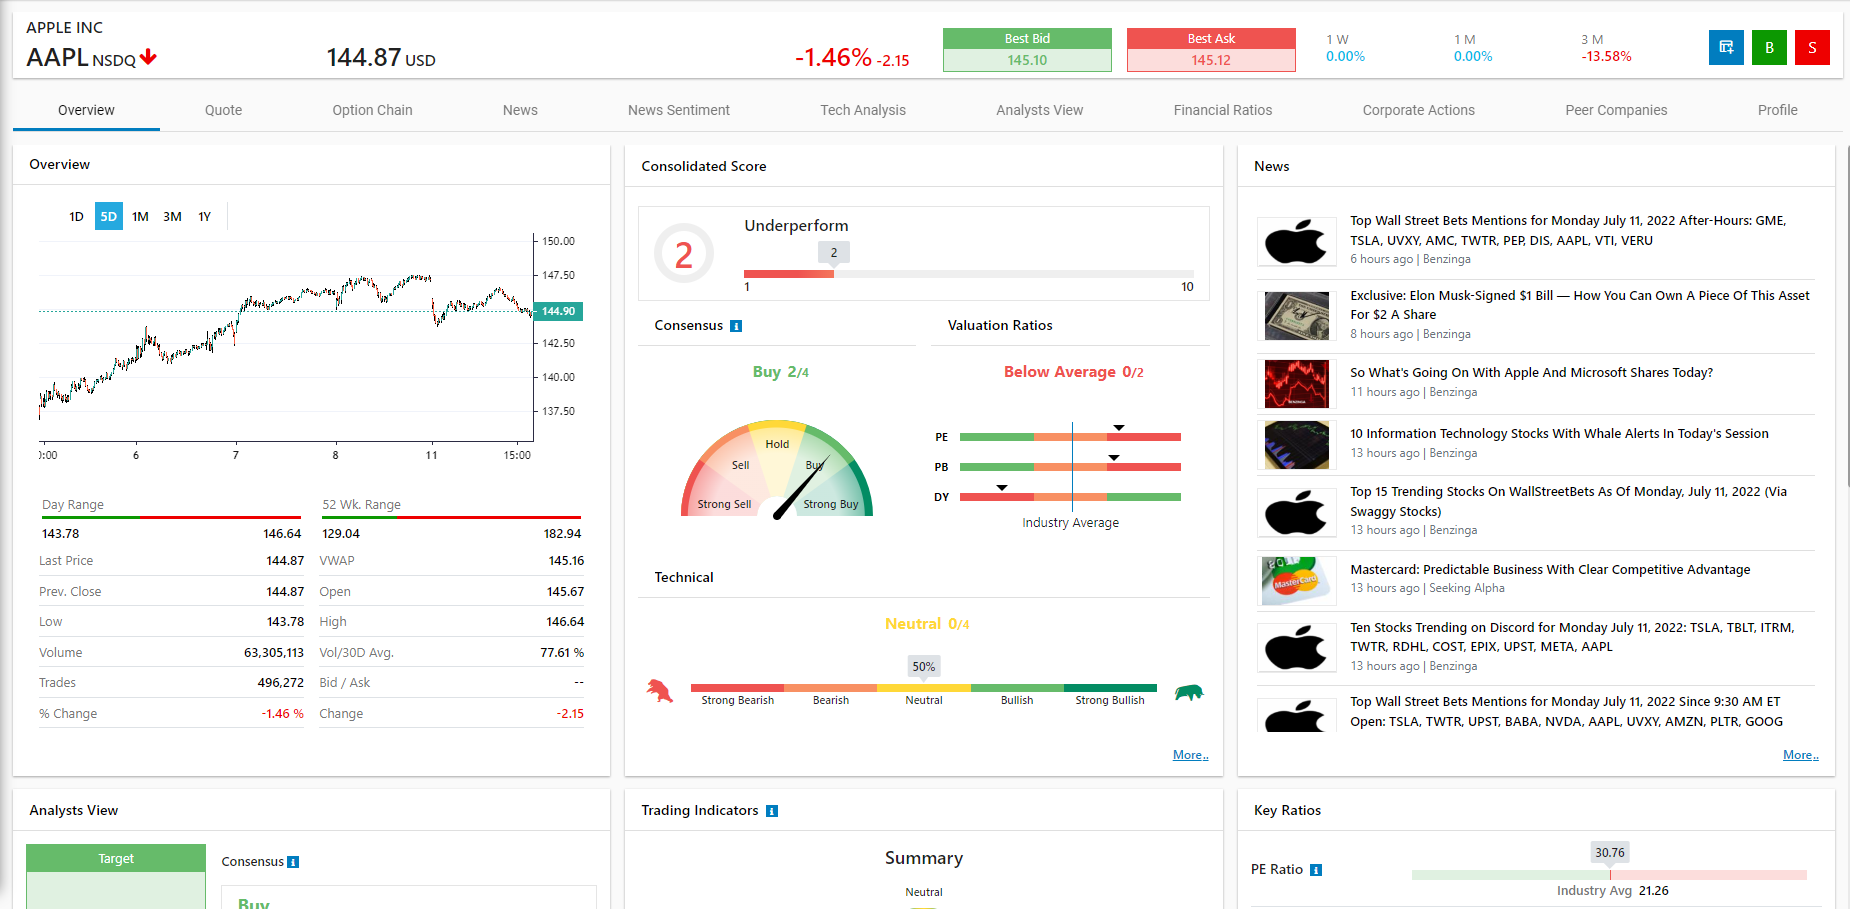
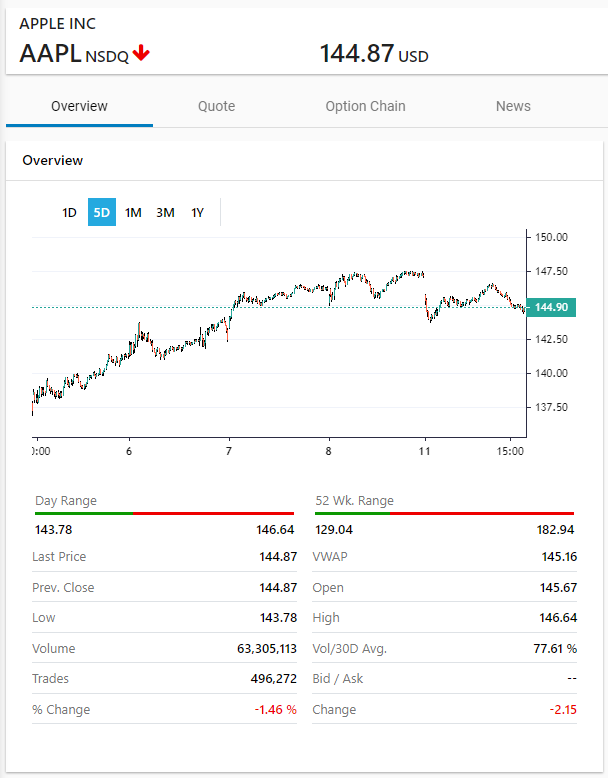
- The Overview tab displays the symbol's performance attributes along with a range of graphical dashboards.

- If you're satisfied with the symbol’s performance after analyzing its attributes, click on the Buy
 or Sell
  buttons (on the top bar) to open an order ticket or simply add it to a watchlist
  to review later.
 - Click on the
 button to subscribe to a recurring subscription.
- The top information card presents basic details such as the ‘trend, current price, % change, best bid, best offer, number of trades, & volume information’.
- Company description - Refers to the company name which is denoted by the stock symbol. I.e. the company descriptor for NKE would be 'Nike Inc'.
- Exchange - Indicated alongside the symbol will be the stock exchange in which it is listed (i.e. NSDQ, NYSE, DFM, ADX, etc.)
- Trend - An Up or Down arrow is displayed next to the symbol name depending on whether the stock's price Increased or Decreased compared to the previous trading day. (i.e. if the stock price at present time is higher than the value yesterday a Green Up arrow would be displayed).
- Current Price - Refers to the current market price at which the stock is trading (displayed below the symbol name within the Overview Tab).
- % Change - The percentage change field refers to how much the stock's price value has changed (increased or decreased) compared to the previous trading day expressed as a percentage.
- Bid Price (or 'Best Bid') – Refers to the highest price a buyer is willing to pay for a stock in the market at a given point in time.
- Ask Price (or 'Best Offer') – Refers to the lowest price at which a seller is willing to sell their stock in the market at a given point in time.
- Bid-Ask Spread – Refers to the difference between the highest price a buyer is willing to pay for a stock and the lowest price that a seller would accept for a stock. It is the value by which the asking price for the symbol exceeds the bid price for the symbol in the market.
- OHLC Information - The Open price refers to the stock's price at market open, i.e. when a market starts trading for the day during normal business hours and begins accepting trades. The High price refers to the highest stock price value recorded within one trading day. Conversely, the Low price refers to the lowest stock price value recorded within one trading day. The Close price refers to the stock's price at market close, i.e. when a market ends trading for the day and stops accepting trades.
- 52-Week High/ Low - A popular stock metric that illustrates the highest or lowest point of a stock's price within a 52-week time window.
- Stock Chart - An area/candlestick chart that illustrates the performance of the stock by plotting the stock price on the Y-axis and time on the X-axis.
- Advanced stock details - Scroll through the stock information section to discover a range of other stock details and performance metrics (I.e. ISIN Code, EPS, PE Ratio, Yield, Range, Spread, VWAP, etc.).
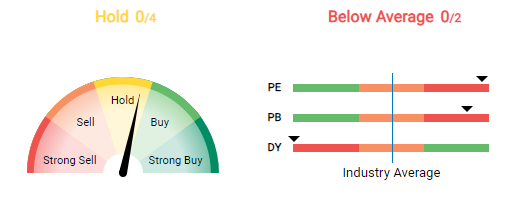
- For symbols in some exchanges, the firm's Price to Earnings ratio (P/E), Price to Book ratio (P/B), and Dividend Yield ratio information are depicted in graphical dashboards. This also draws a comparison between the firm's performance and the industry average.
- These are termed 'fundermentals' as they are critical measures of a firm's financial health and sustainability. They analyze the financial strength of a company over the short and long term.
- When analyzed at the aggregate level, these graphical widgets provide the trader with useful insights into a company’s financial health enabling them to make the smartest investment decision possible at the time.
- Note that if any of the ratios have a negative value, then the app would display an "N/M" label as this isn't meaningful to the analysis.
While on the stock-profile page, switch tabs to the Quotes section to get a Detail Quote which includes Market Depth as well as Time & sales information for the selected Symbol.
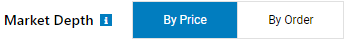
Market Depth
- Market depth data is used by traders in order to ascertain whether the symbol can sustain relatively large sell orders without affecting its current market price negatively.
- Generally, the stronger the market depth ("deeper" with many depth levels), the higher its liquidity and its ability to sustain a shock from large volume orders. The depth information table is also used to understand the bid-ask spread of a particular symbol.
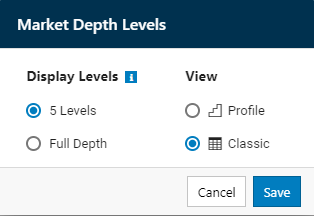
- Market Depth can be viewed by Price, or by Order. You may switch views using the buttons alongside the widget.
- By default the app limits market depth data to 5 levels, however, if you wish to view full depth you can do so by clicking the
 icon located near the Market Depth widget. Select your preferred depth option and click on Save to confirm.
Time and Sales
- Symbol time and sales data are records of the latest transactions (buy/sell-side) that have occurred for the selected symbol.
- Symbol time and sales are displayed as follows.
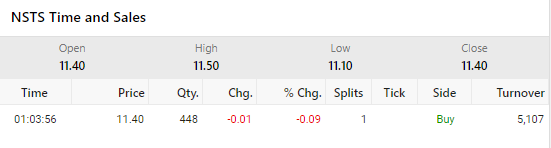
- Time and sales information can be used by traders to assess different performance attributes of the stock like the directionality, price, and volume over intervals of time.
- An Up
 arrow in the Tick column for a time and sales record indicates that at that time, the symbol traded above its current market price (the variance between traded price vs current price is expressed in the % change column).
- A Down
 arrow in the Tick Column for a time and sales record indicates that at that time, the symbol traded below its current market price.
- An Equals
 sign in the Tick Column for a time and sales record indicates that at that time, the symbol traded at the current market price.
- Corporate actions are simply any event (i.e. a news article) or any action taken by a company's management that could impact the price of its stock or security (i.e. ETFs, mutual funds, or fixed-income securities). Typically corporate changes such as mergers and acquisitions (M&A activity), or a change in the senior leadership of the firm could result in price movements on the stock chart, as investors react to the change positively or negatively.
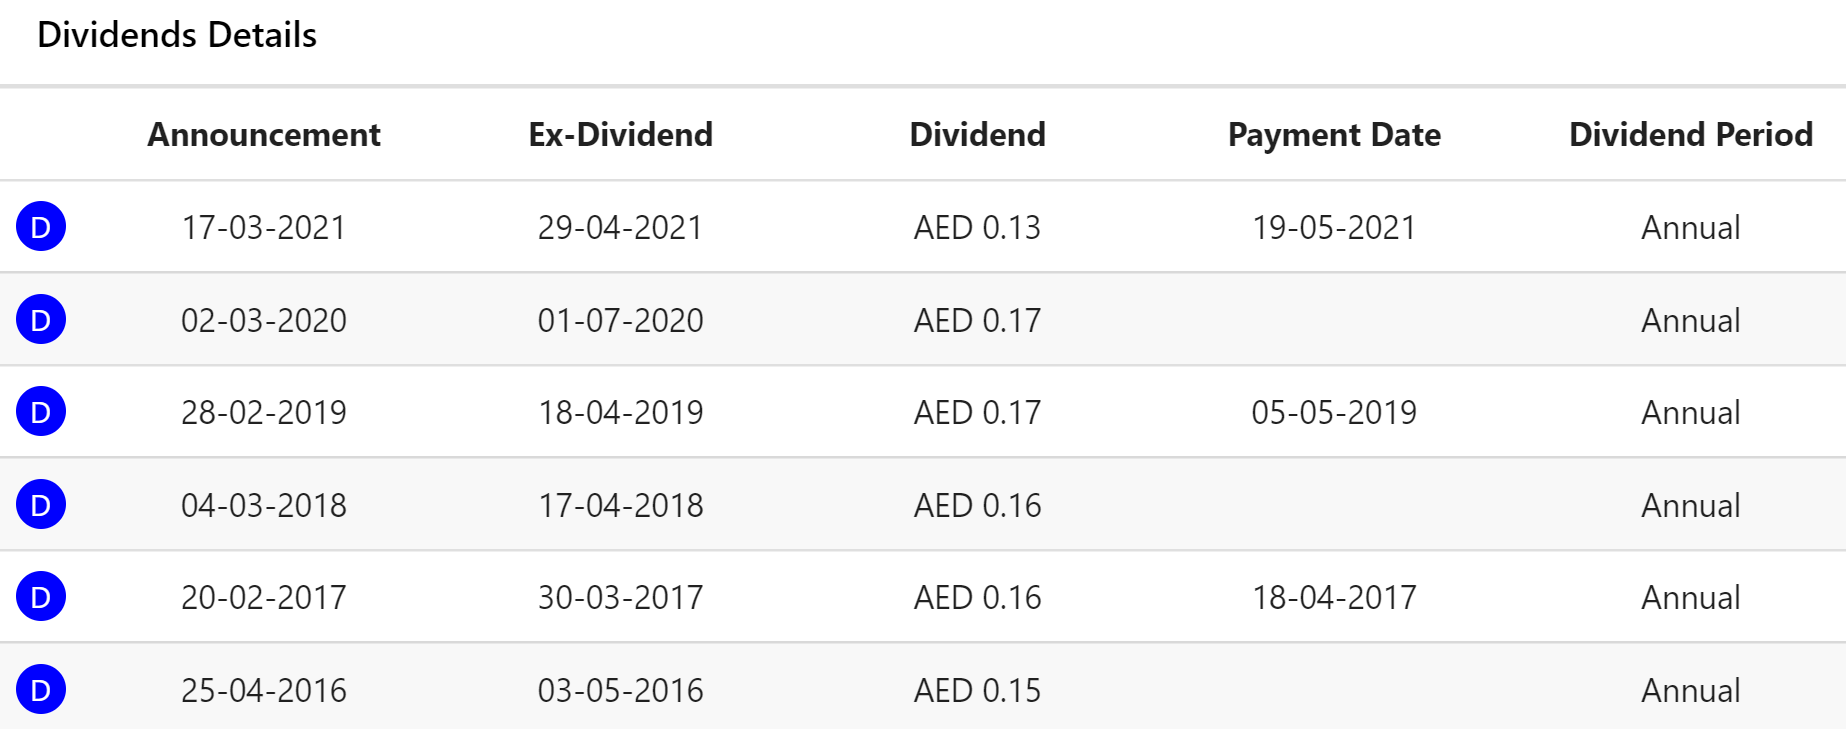
- The dividend details of the company are displayed in a widget table (dates in which a dividend was paid), along with any other events/ actions that could affect the symbol or security.
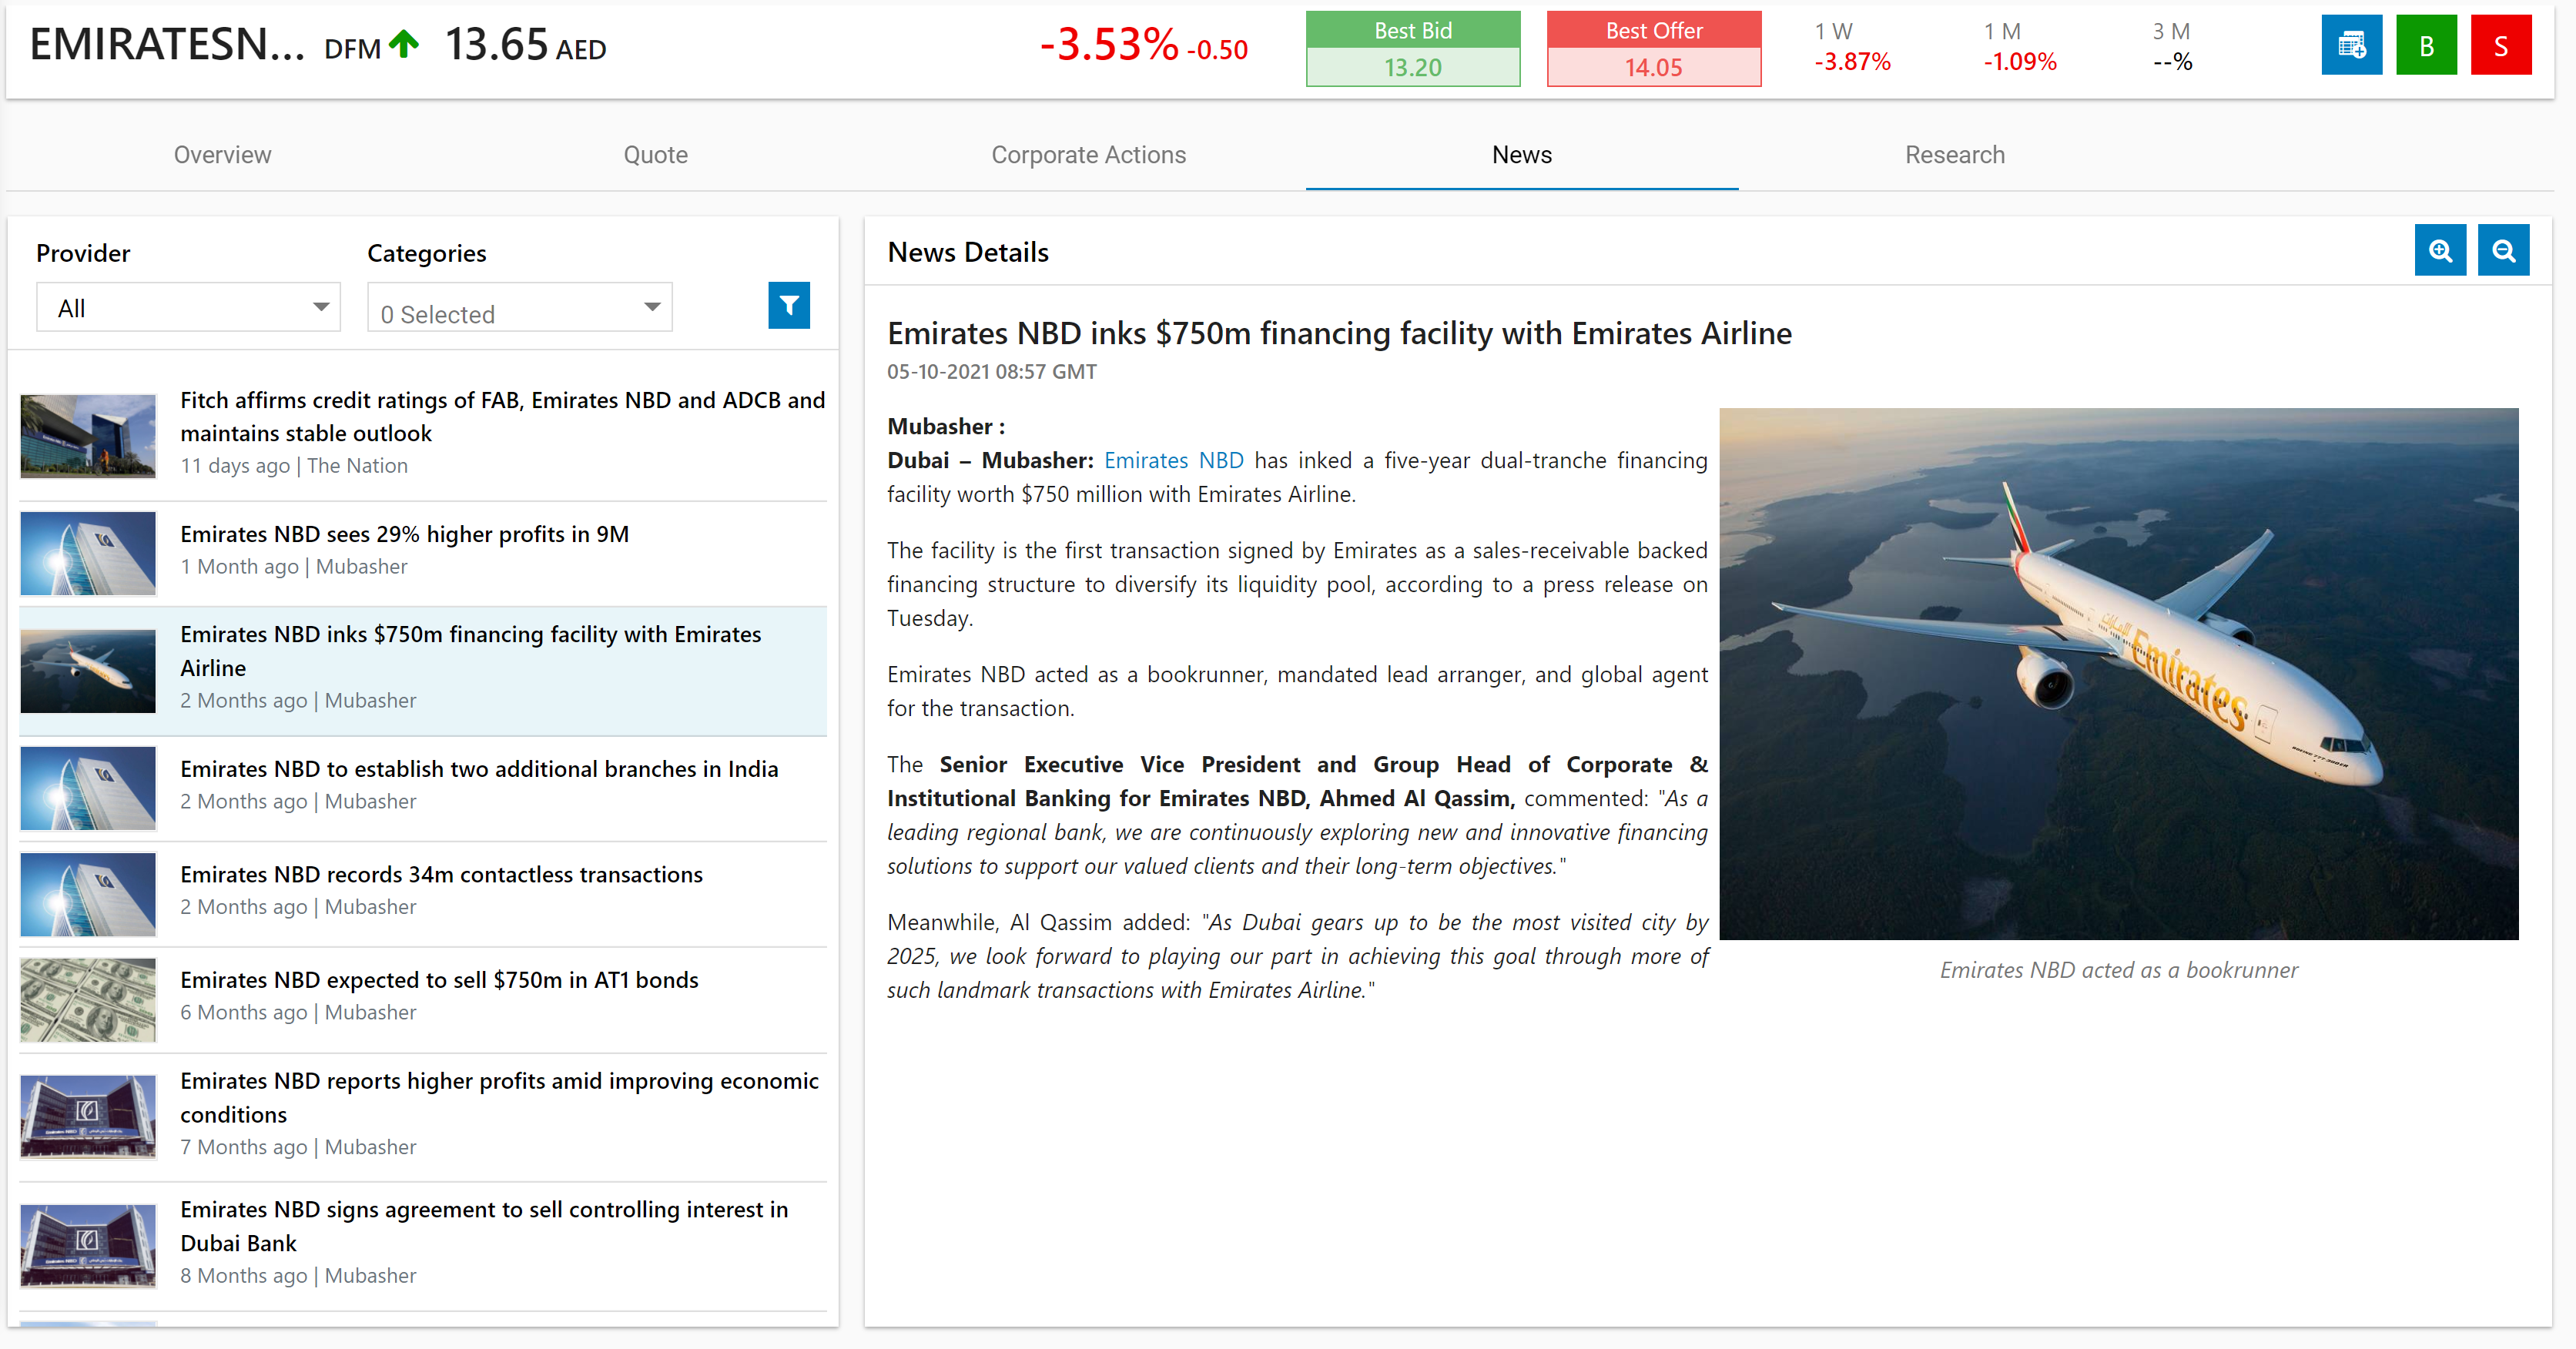
- The panel on the left contains a list of the latest News articles related to the selected symbol along with filter options.
- Click on a news item/ article from the panel on the left and the 'News Details' (news article) should appear on the right.
- You may filter the list based on a specific Provider, by news Categories, or by Date and Language.
- To access the date and language filters simply click on the filter
 button to expand the options.
- This interface contains a range of financial research information related to the company and its performance.
- This includes the latest bullish or bearish signals for the stock symbol, and snapshots on the company's income statement, balance sheet, dividend yield, and PE ratio. It also displays technical research reports if available.
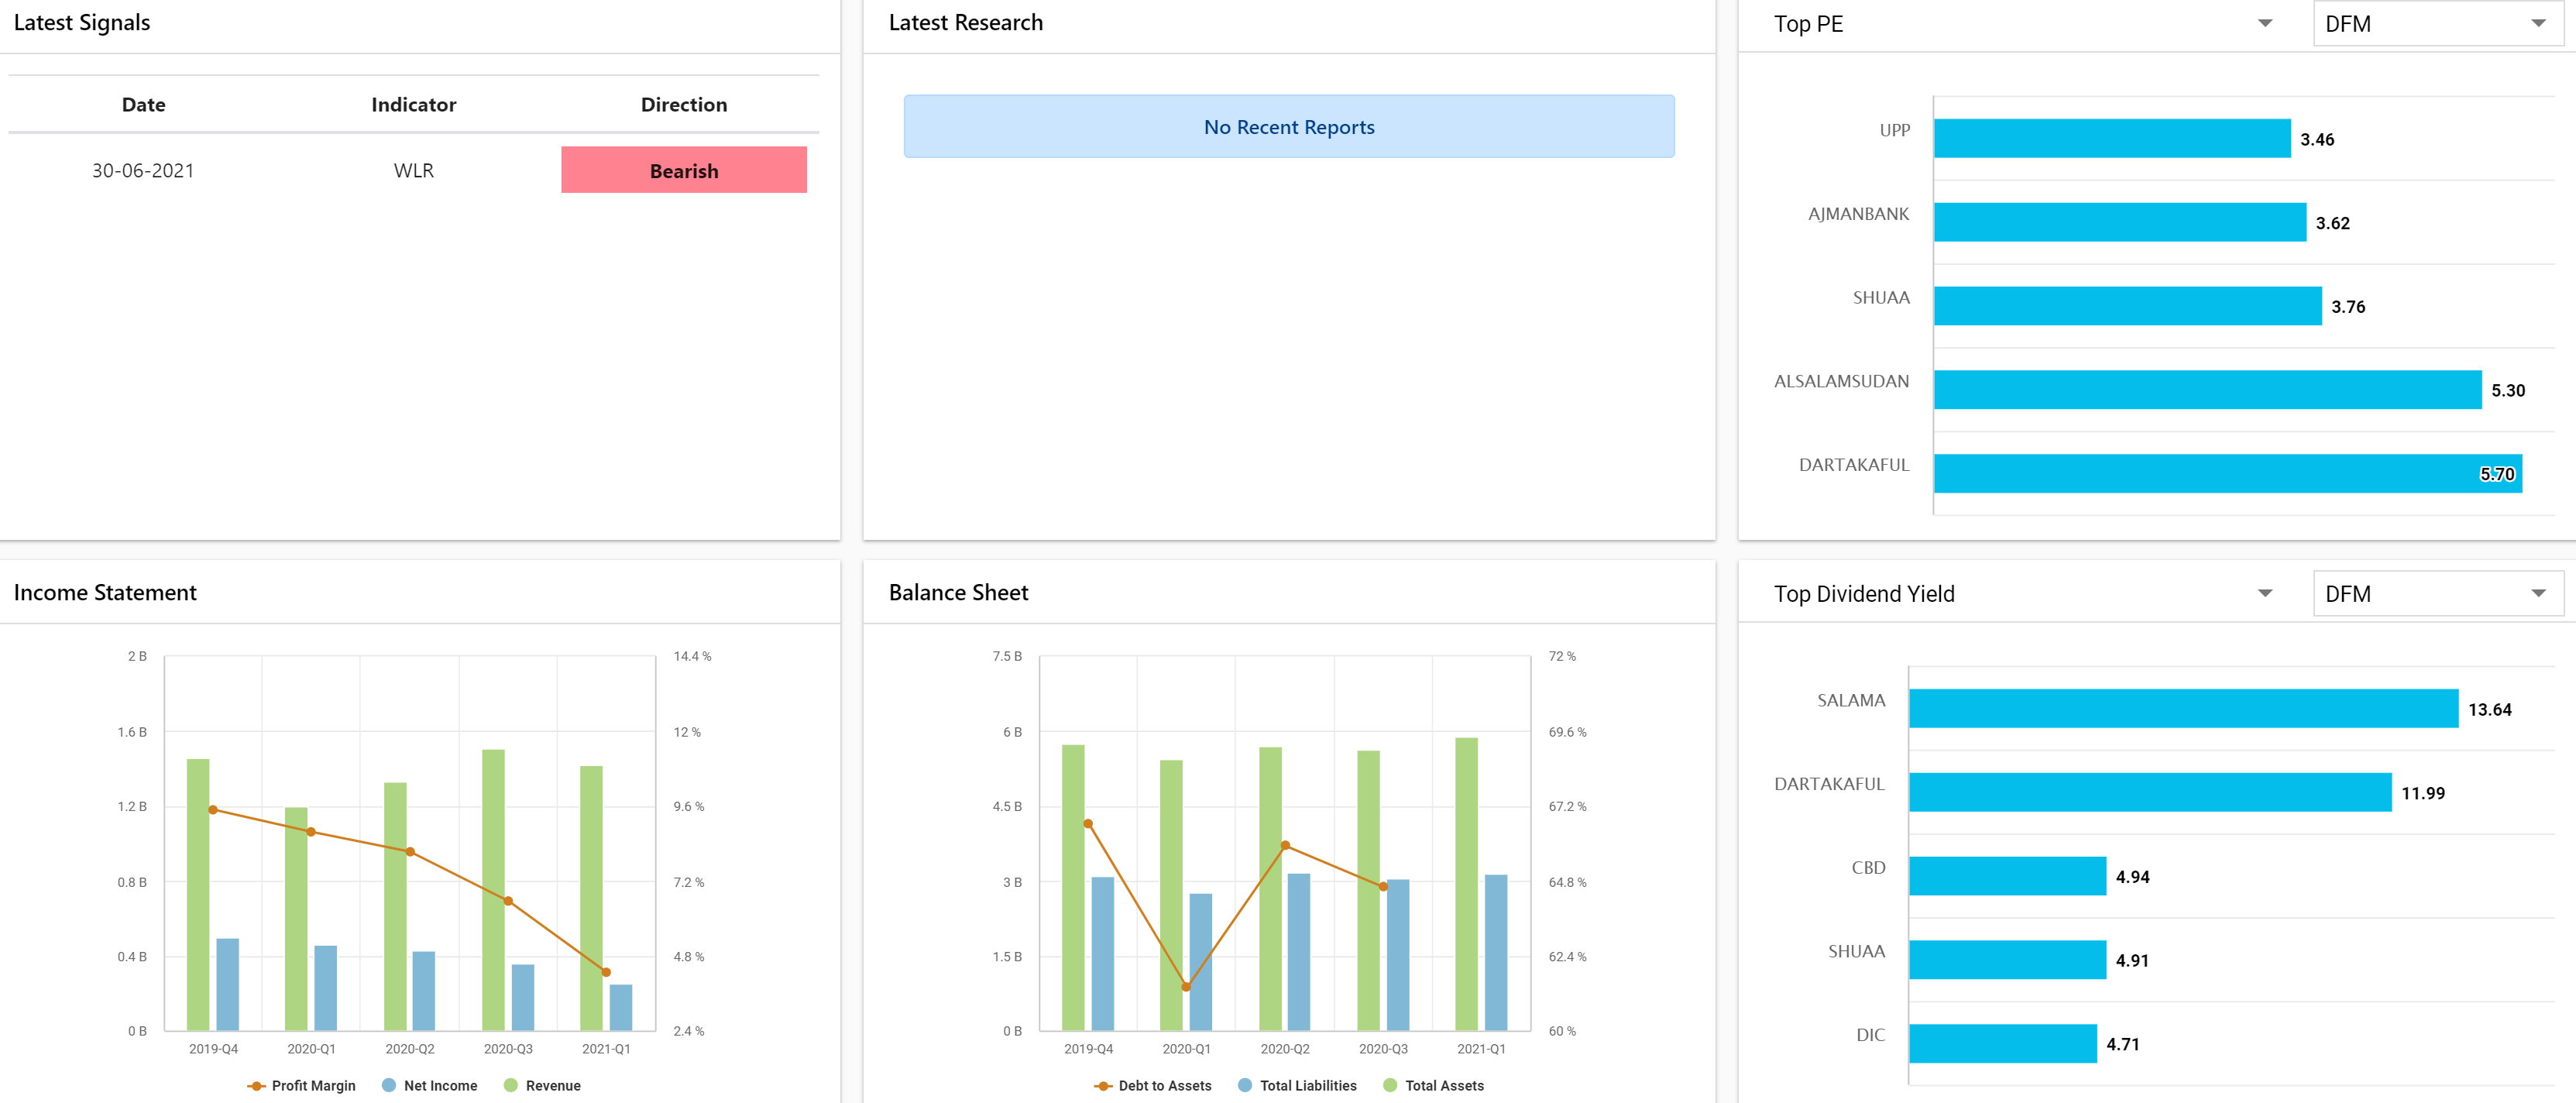
- Please note this tab will only appear in the Stock Profile for symbols in some exchanges (i.e. NYSE, LSE, etc.)
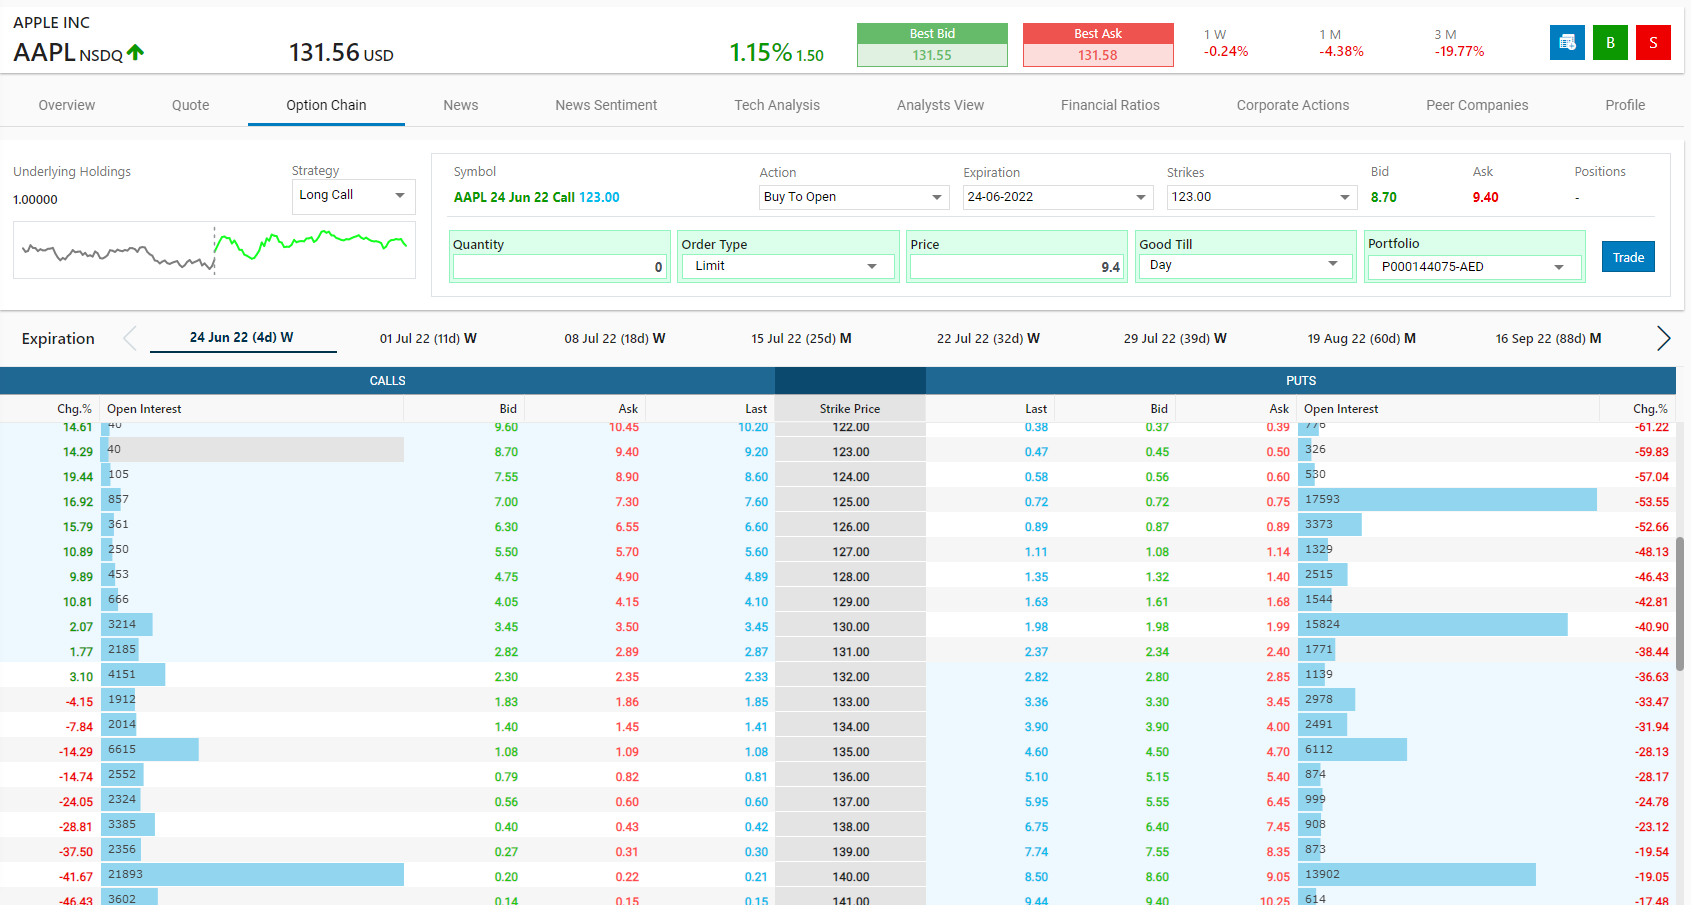
- This tab displays the call and put options for the selected symbol.
- An Options contract is a type of derivative financial security as it derives its value from other securities like stocks. The options contract provides the trader with the option to buy/sell the asset at a specific price.
- A Call option is a contract that offers the buyer the option to buy the asset (i.e. a stock) at a specific price and within a stipulated time window.
- A Put option is a contract that offers the owner of an asset to sell it at a specific price and within a stipulated time window.
- Select the strategy you prefer, using the Strategy drop down. Options trading provides a number of different strategies.
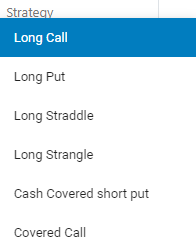
- Long Call : A simple bullish strategy that offer a significant growth potential and investors realize gains when the market price rises above the strike price. You can simply buy and sell a call before it expires to profit off the price range.
- Long Put : A simple bearish strategy that can yield big rewards. You would purchase a put option if you believe that the stock is going to fall, since the value of a put goes up if the underlying stock price goes down. However, this option also has the risk of expiring completely worthless upon the expiration date.
- Long Straddle : A long straddle consists of one long call and one long put. Both options have the same underlying stock, the same strike price and the same expiration date. A long straddle is established for a net debit (or net cost) and profits if the underlying stock rises above the upper break-even point or falls below the lower break-even point.
- Long Strangle : A strangle is similar to a straddle, except that the put and call are at different strikes. These out-of-the-money options make a strangle cheaper than a straddle, but require a bigger move to make a profit.
- Cash Covered short put : An options strategy where a seller enters a short put position for which he receives cash. In exchange for that cash however, the seller is obligated to buy the underlying stock should the buyer of the put option (long position) wish to exercise it.
- Covered Call : An options strategy that involves holding a long position in the underlying asset and selling a call option on the underlying asset. This strategy is usually employed by investors who believe that the underlying asset will experience only minor price fluctuations.
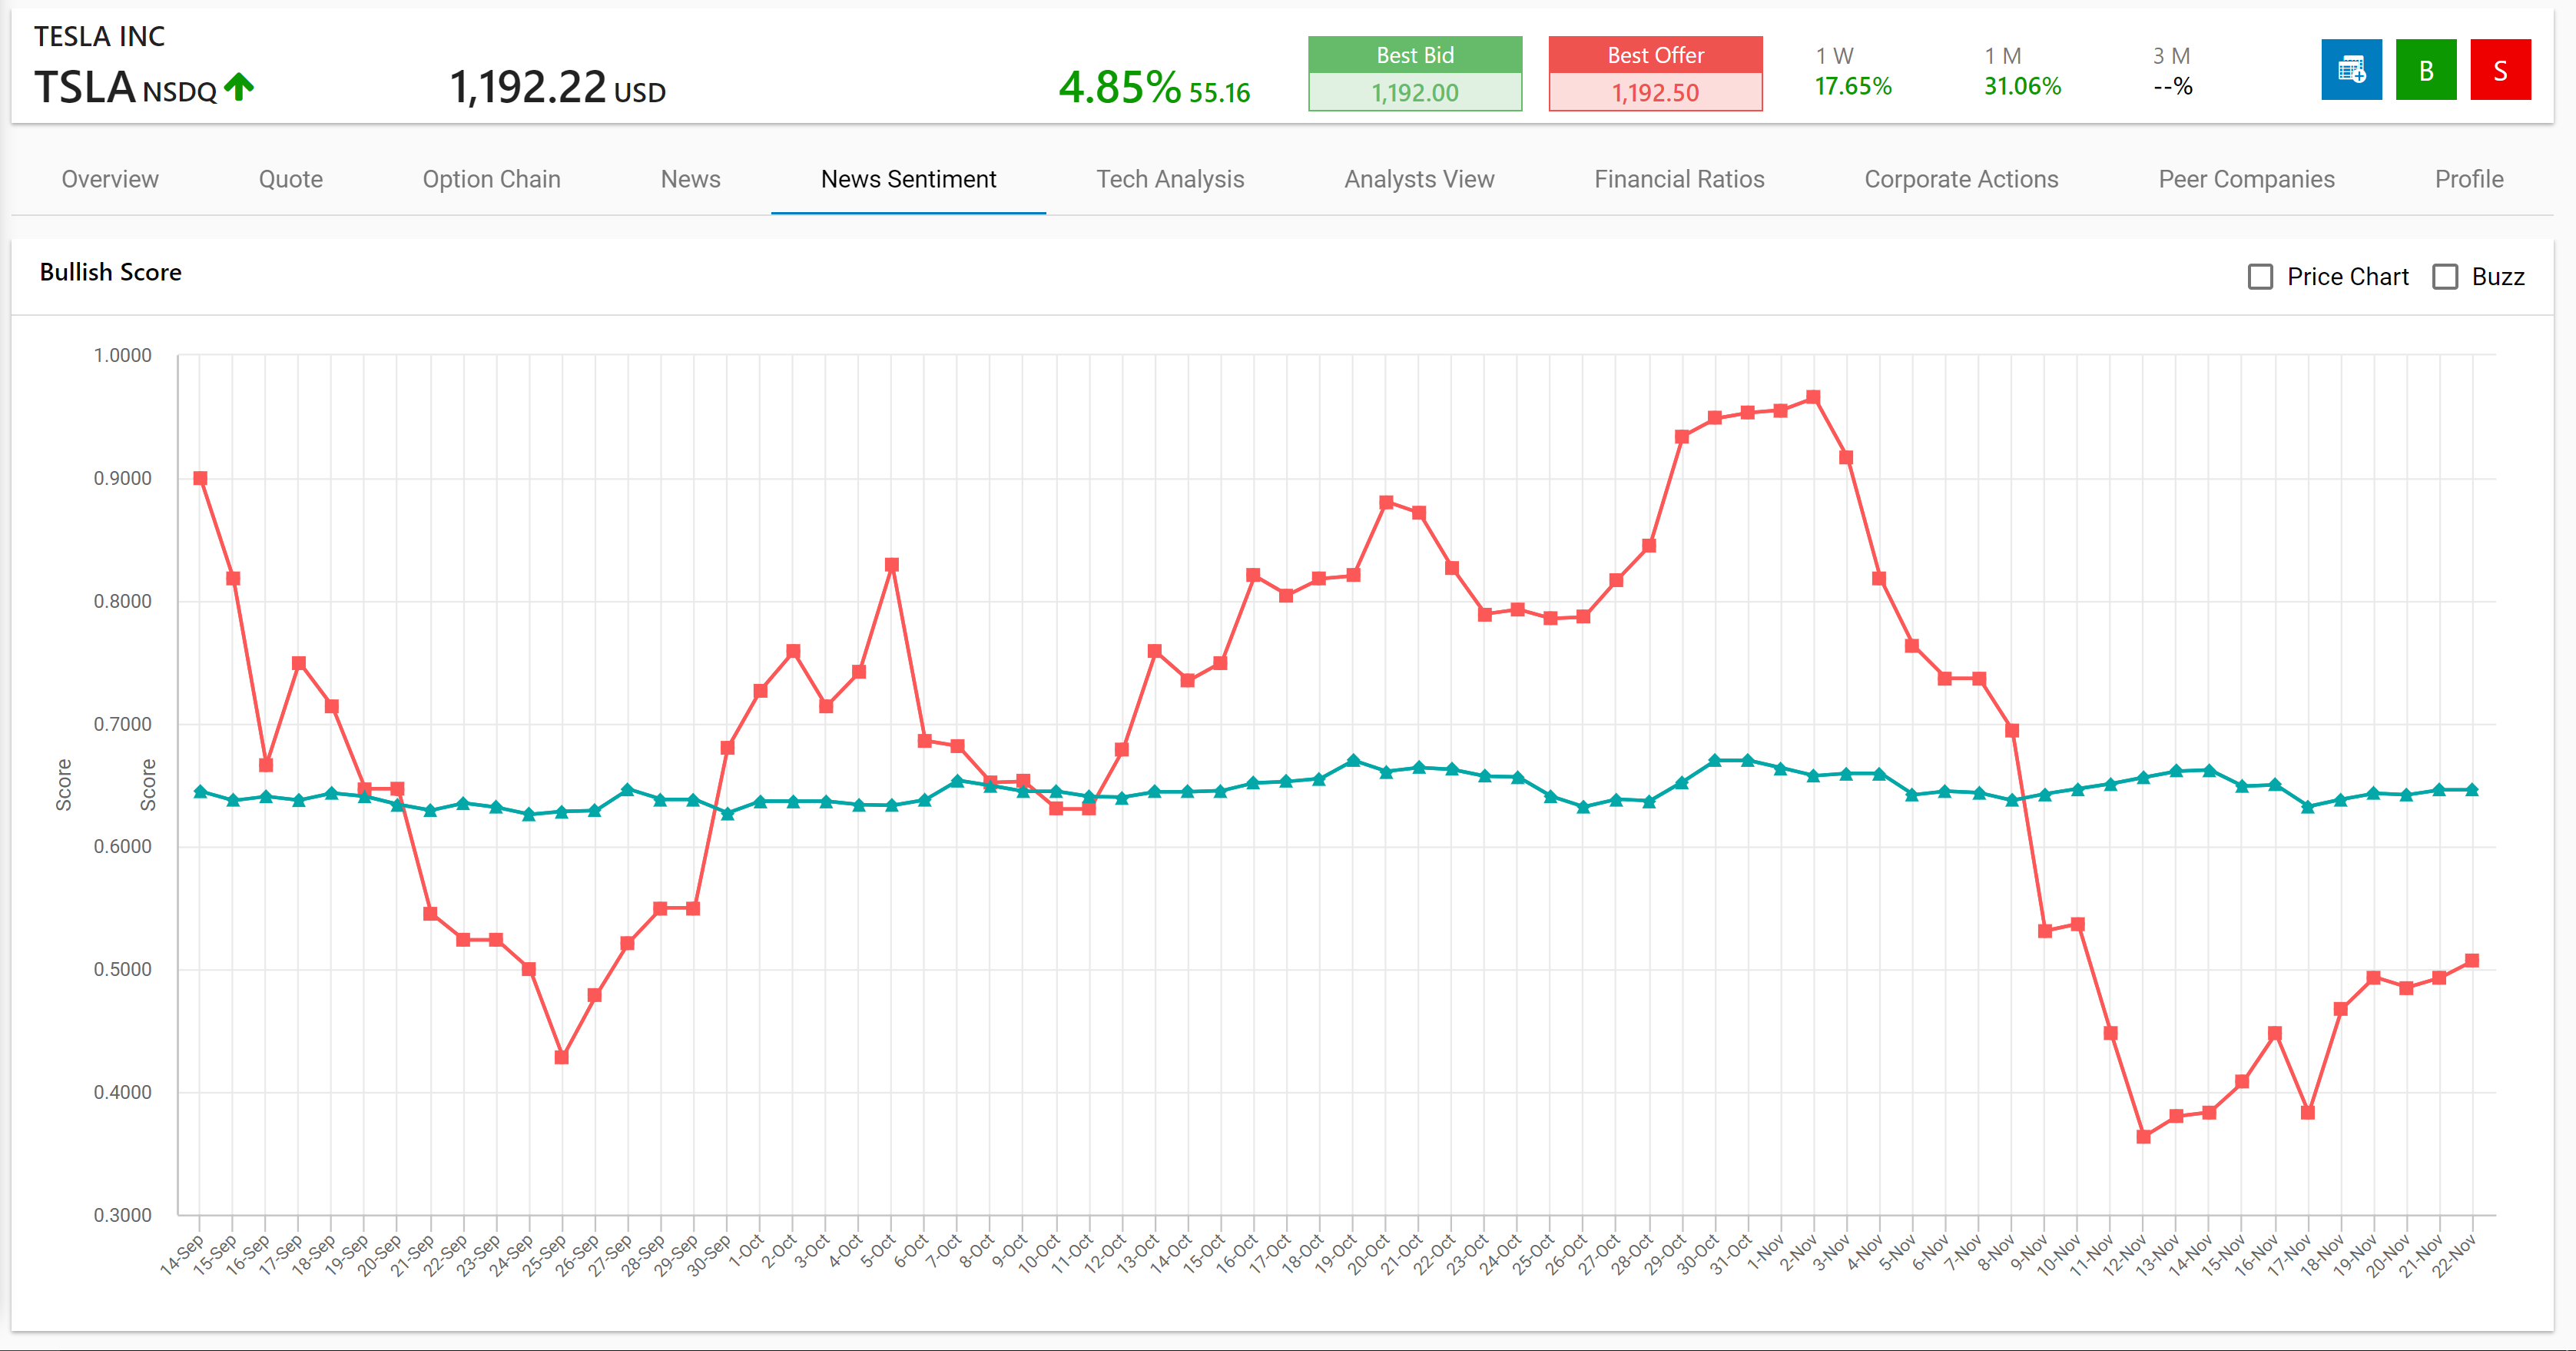
- Shows the overall trending attitude of investors towards a particular stock.
- This is depicted in the chart through the “Bullish score” line which is indicative of how “bullish” investors are at a given time regarding the stock’s value to rise.
- The stock’s bullish score can be compared to the Industry Average bullish score, in order to serve as a credible reference point for benchmark analysis.
The tab contains a range of technical analysis tools (i.e. patterns, & indicators) used to evaluate the stock's performance through different perspectives. These are represented via the candlestick charts and the aggregated graphical dashboards.
Technical Signals
Note: The complete list of signals for US exchanges (NSDQ, NYSE, AMEX) is provided in the table contained in Trading Signals.
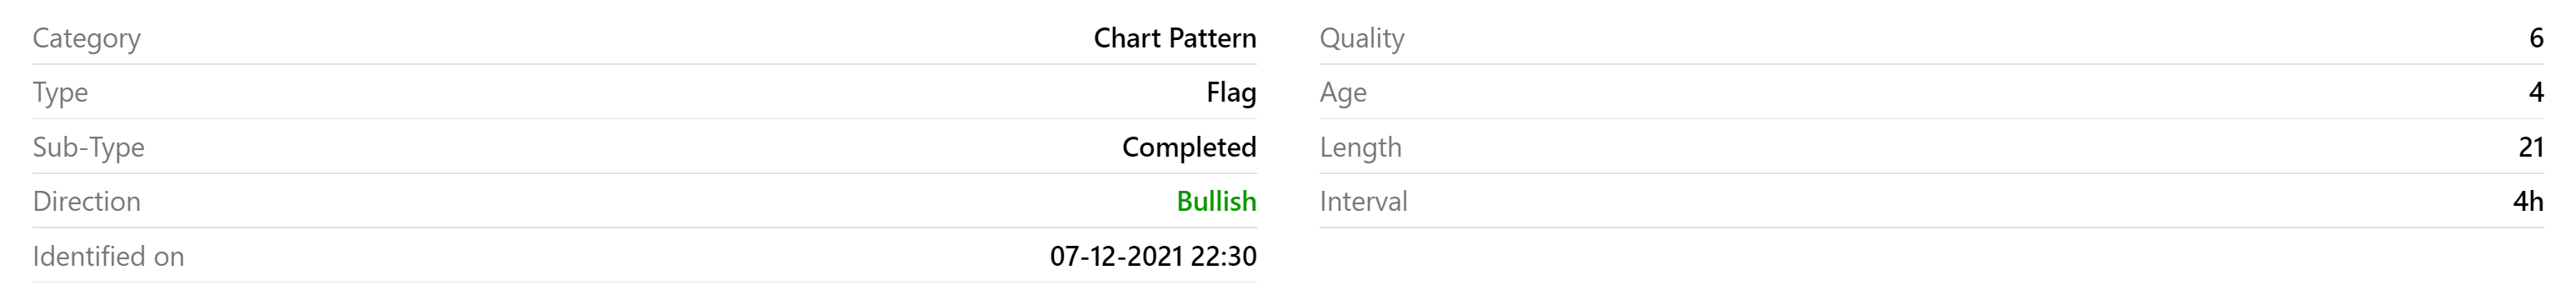
- Pattern: Refers to the pattern identified in the candlestick chart.
- The support and resistance lines can tell investors the expected/ likely direction of stock price movement and the possible range of future outcomes.
- The Support line is the region of the stock’s price graph where a downfall in price is expected to pause (or drop no further than that point due to demand-side forces).
- The Resistance line is the region of the stock’s price graph where a rise in price is expected to pause (or rise no further than that point due to supply-side forces).
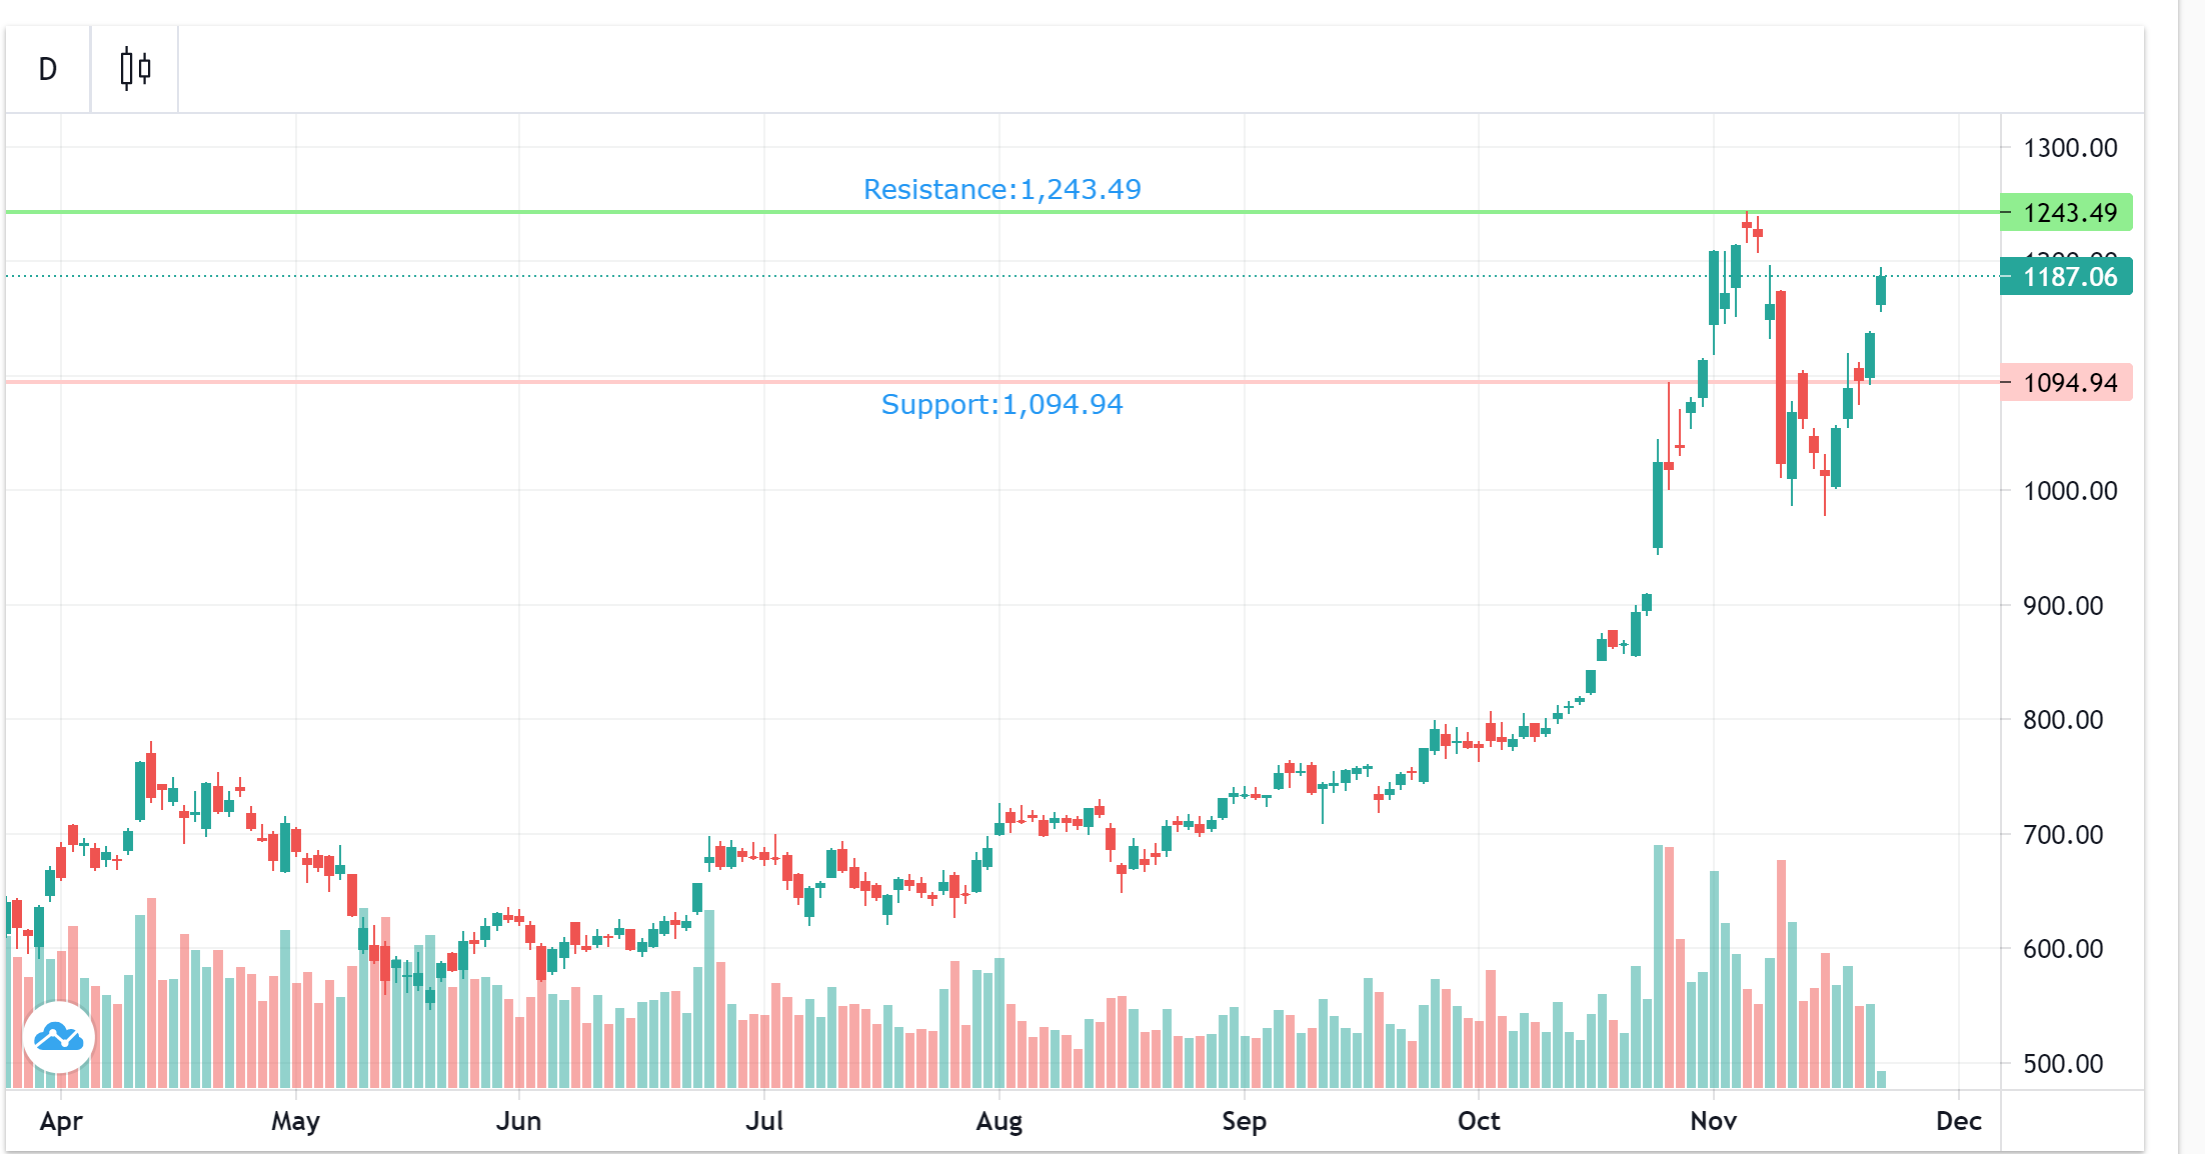
- It should be noted that investor psychology would play a role in predicting future price movements as people often draw judgments based on past performance and events.
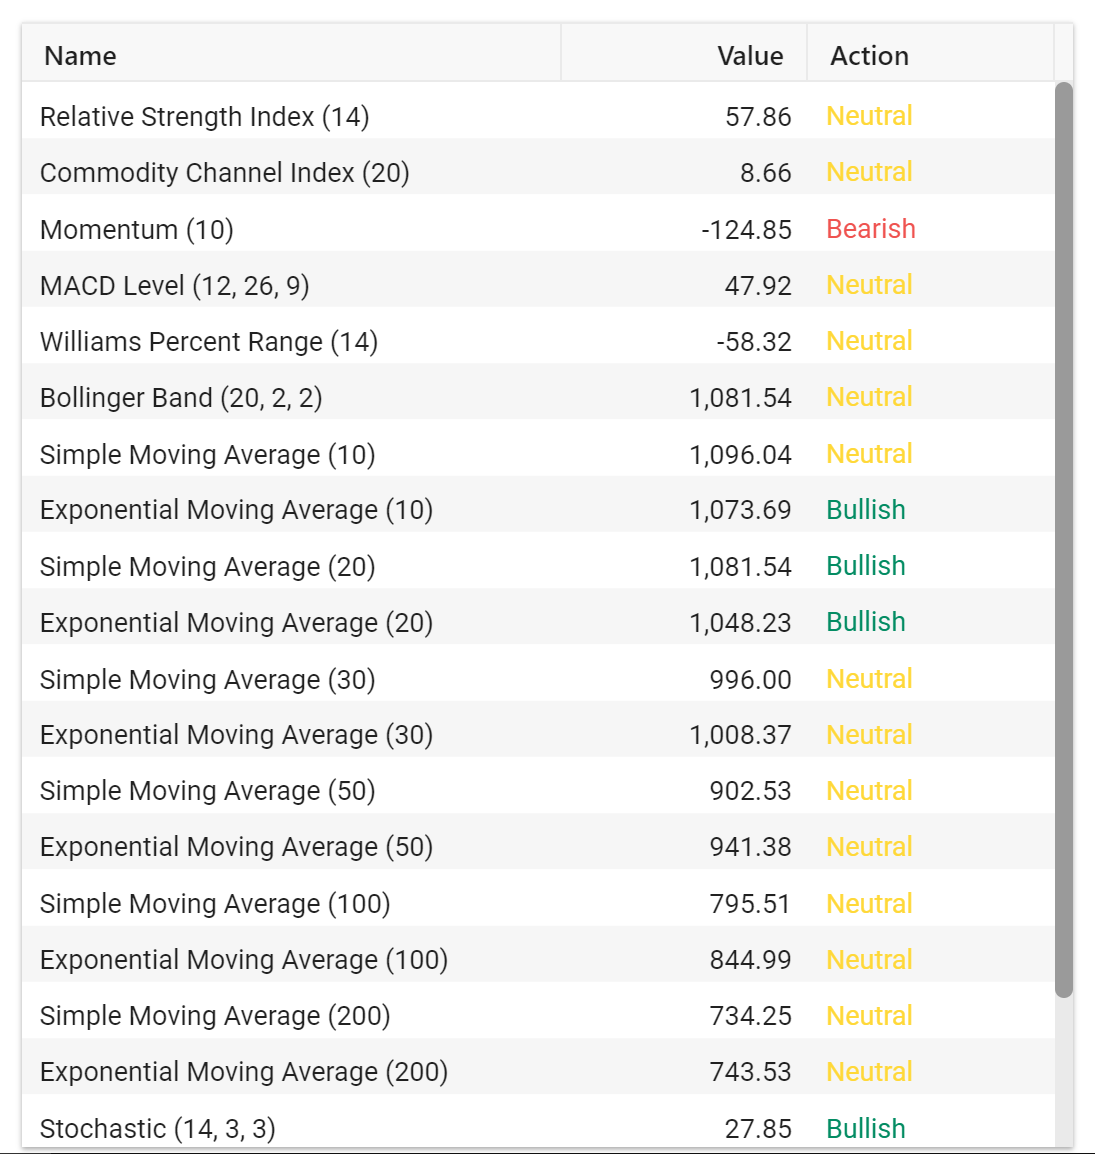
Technical Indicators (Dashboard)
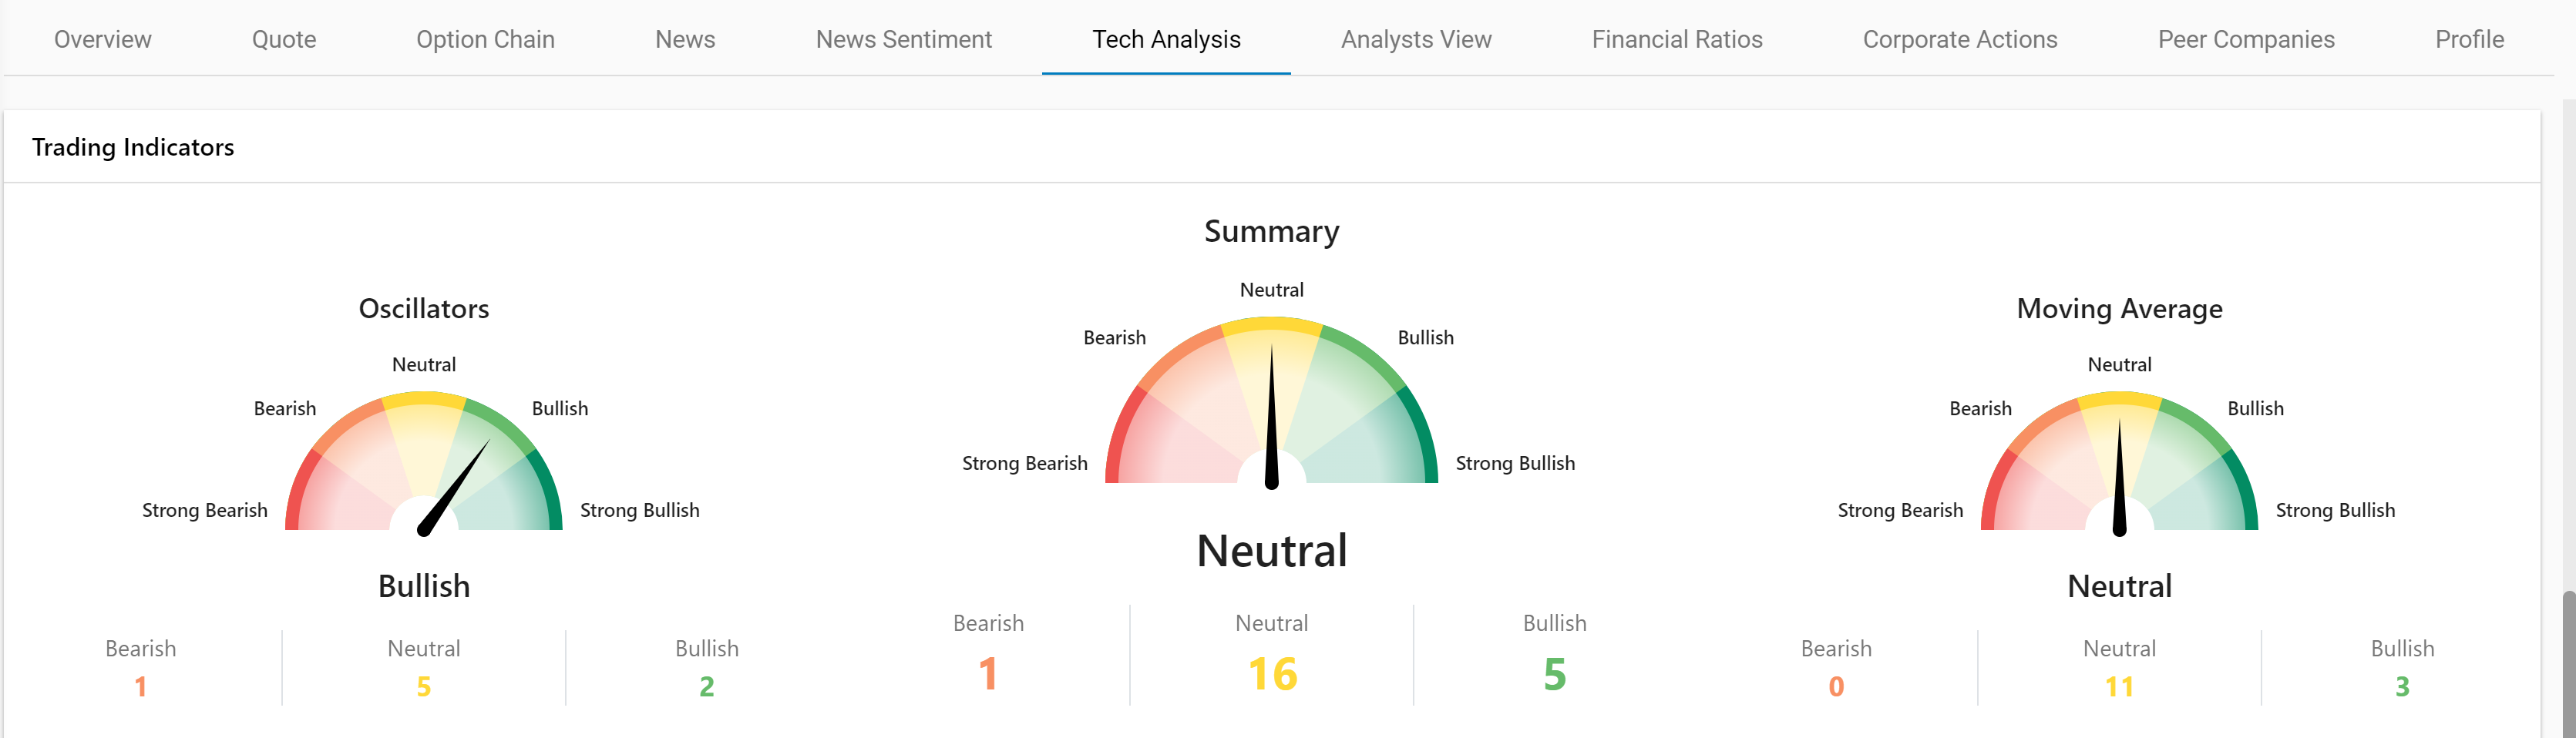
- An Oscillator is a type of momentum indicator. It represents a stock’s overall momentum over time while taking into account its fluctuations in the high and low bands. The oscillator builds a line in between the high and low bands of the graph.
- They can tell investors if a stock is being overbought or oversold in the short term.
- Summary
- The “Summary” dashboard meter displays the overall/ average investor sentiment (or mood) by ‘averaging out’ the values of multiple technical indicators and oscillators (i.e. The RSI or Relative Strength Index, Simple Moving Average, Exponential Moving Average, etc.)
- Depending on the summative indicator analysis results, the overall investor sentiment for a stock could be either bearish, neutral, or bullish.
- (i.e. if many indicators are displaying a ‘Neutral’ outlook then the Summary indicator dashboard is likely to display the same).
- This enables traders to take a glance at the overall market sentiment for the symbol before deciding to buy/ sell the symbol.
- Moving average
- Shows the current investor sentiment based on a moving average calculation of the stock price.
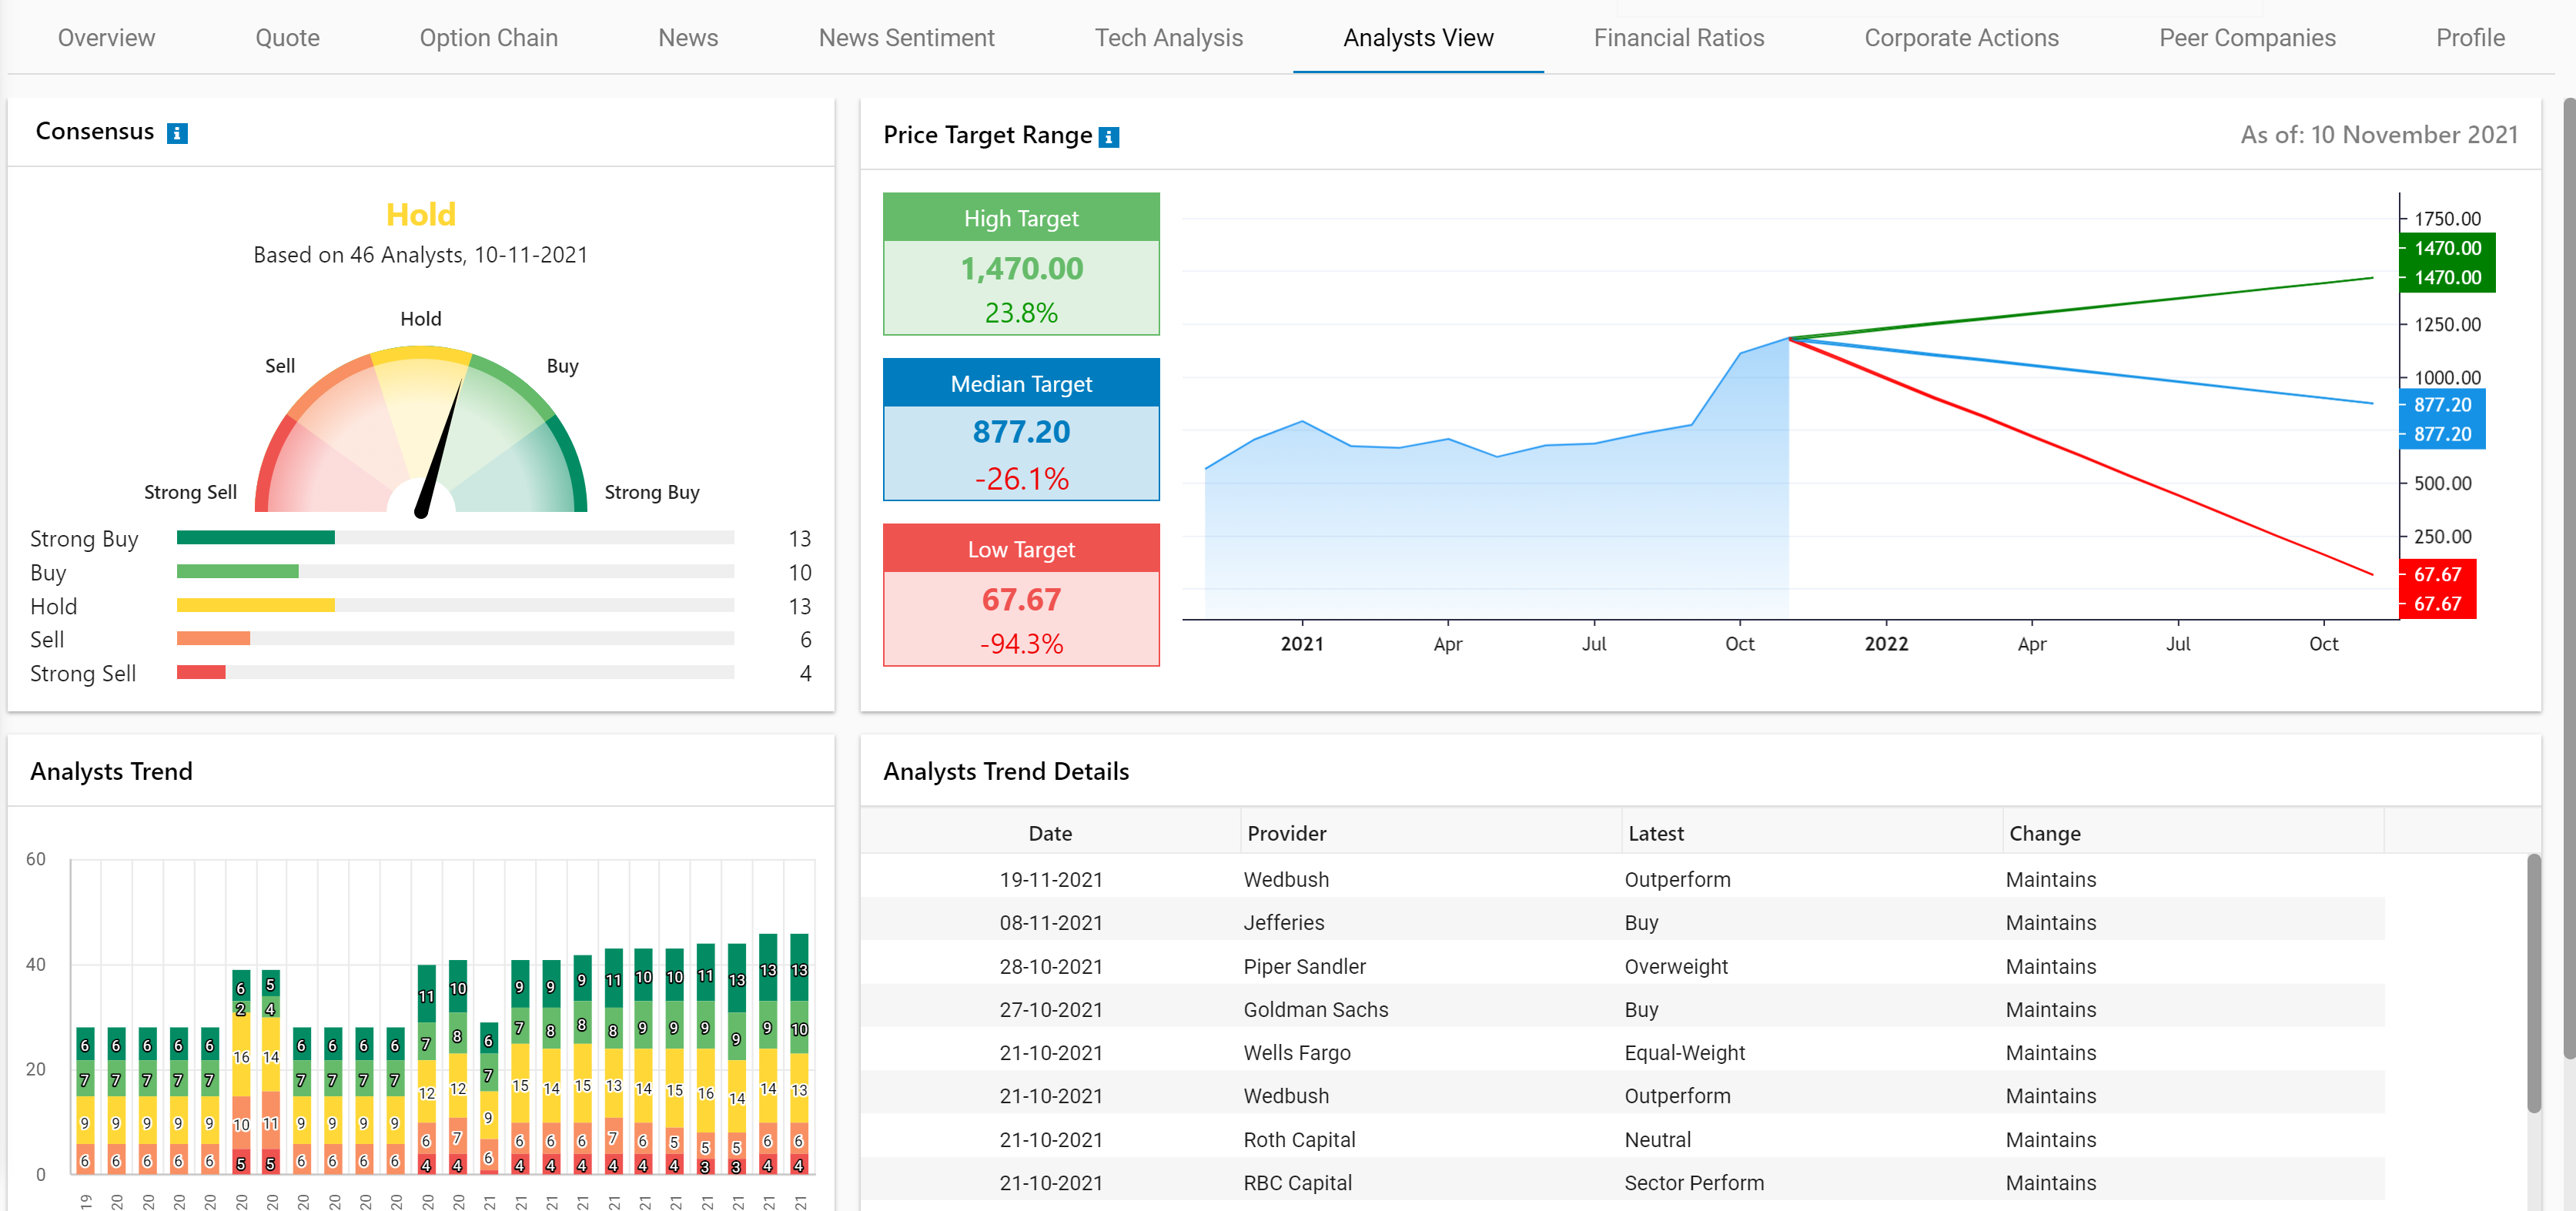
- Consensus
- This dashboard is constructed based on the average recommendations by multiple analysts. Investor confidence in a stock or security depends on multiple factors such as news in the press, state of the international economy, the company's fundamentals, technical analysis, and more.
- It represents whether the overall investor consensus is to 'Buy', or 'Sell' the stock based on investor sentiment on a given date.
- Price Target Range
- This graph displays the range of all possible outcomes for the price movement of a stock (anticipating the future directionality of the stock).
- i.e. these possible outcomes are represented by the potential high, median, or low stock price value outcomes.
- This is highly insightful to traders and investors as it lets them prepare for both the best and worst-case scenarios.
Consolidated Scores
- Displays the performance metrics of competitor firms operating in the same industry.
- This includes the Consensus dashboard, Valuation Ratios, and a Technical Analysis summary.
Peers List
- This table contains the full list of competitor/ peer companies along with their consolidated scores, technical and financial ratio metrics.
Peers Comparison
- If the exact peers aren't listed by default, you may always add the stock of the company you wish to compare by typing its name in the 'Add Symbol' text field and selecting it when it appears in the autocomplete list.
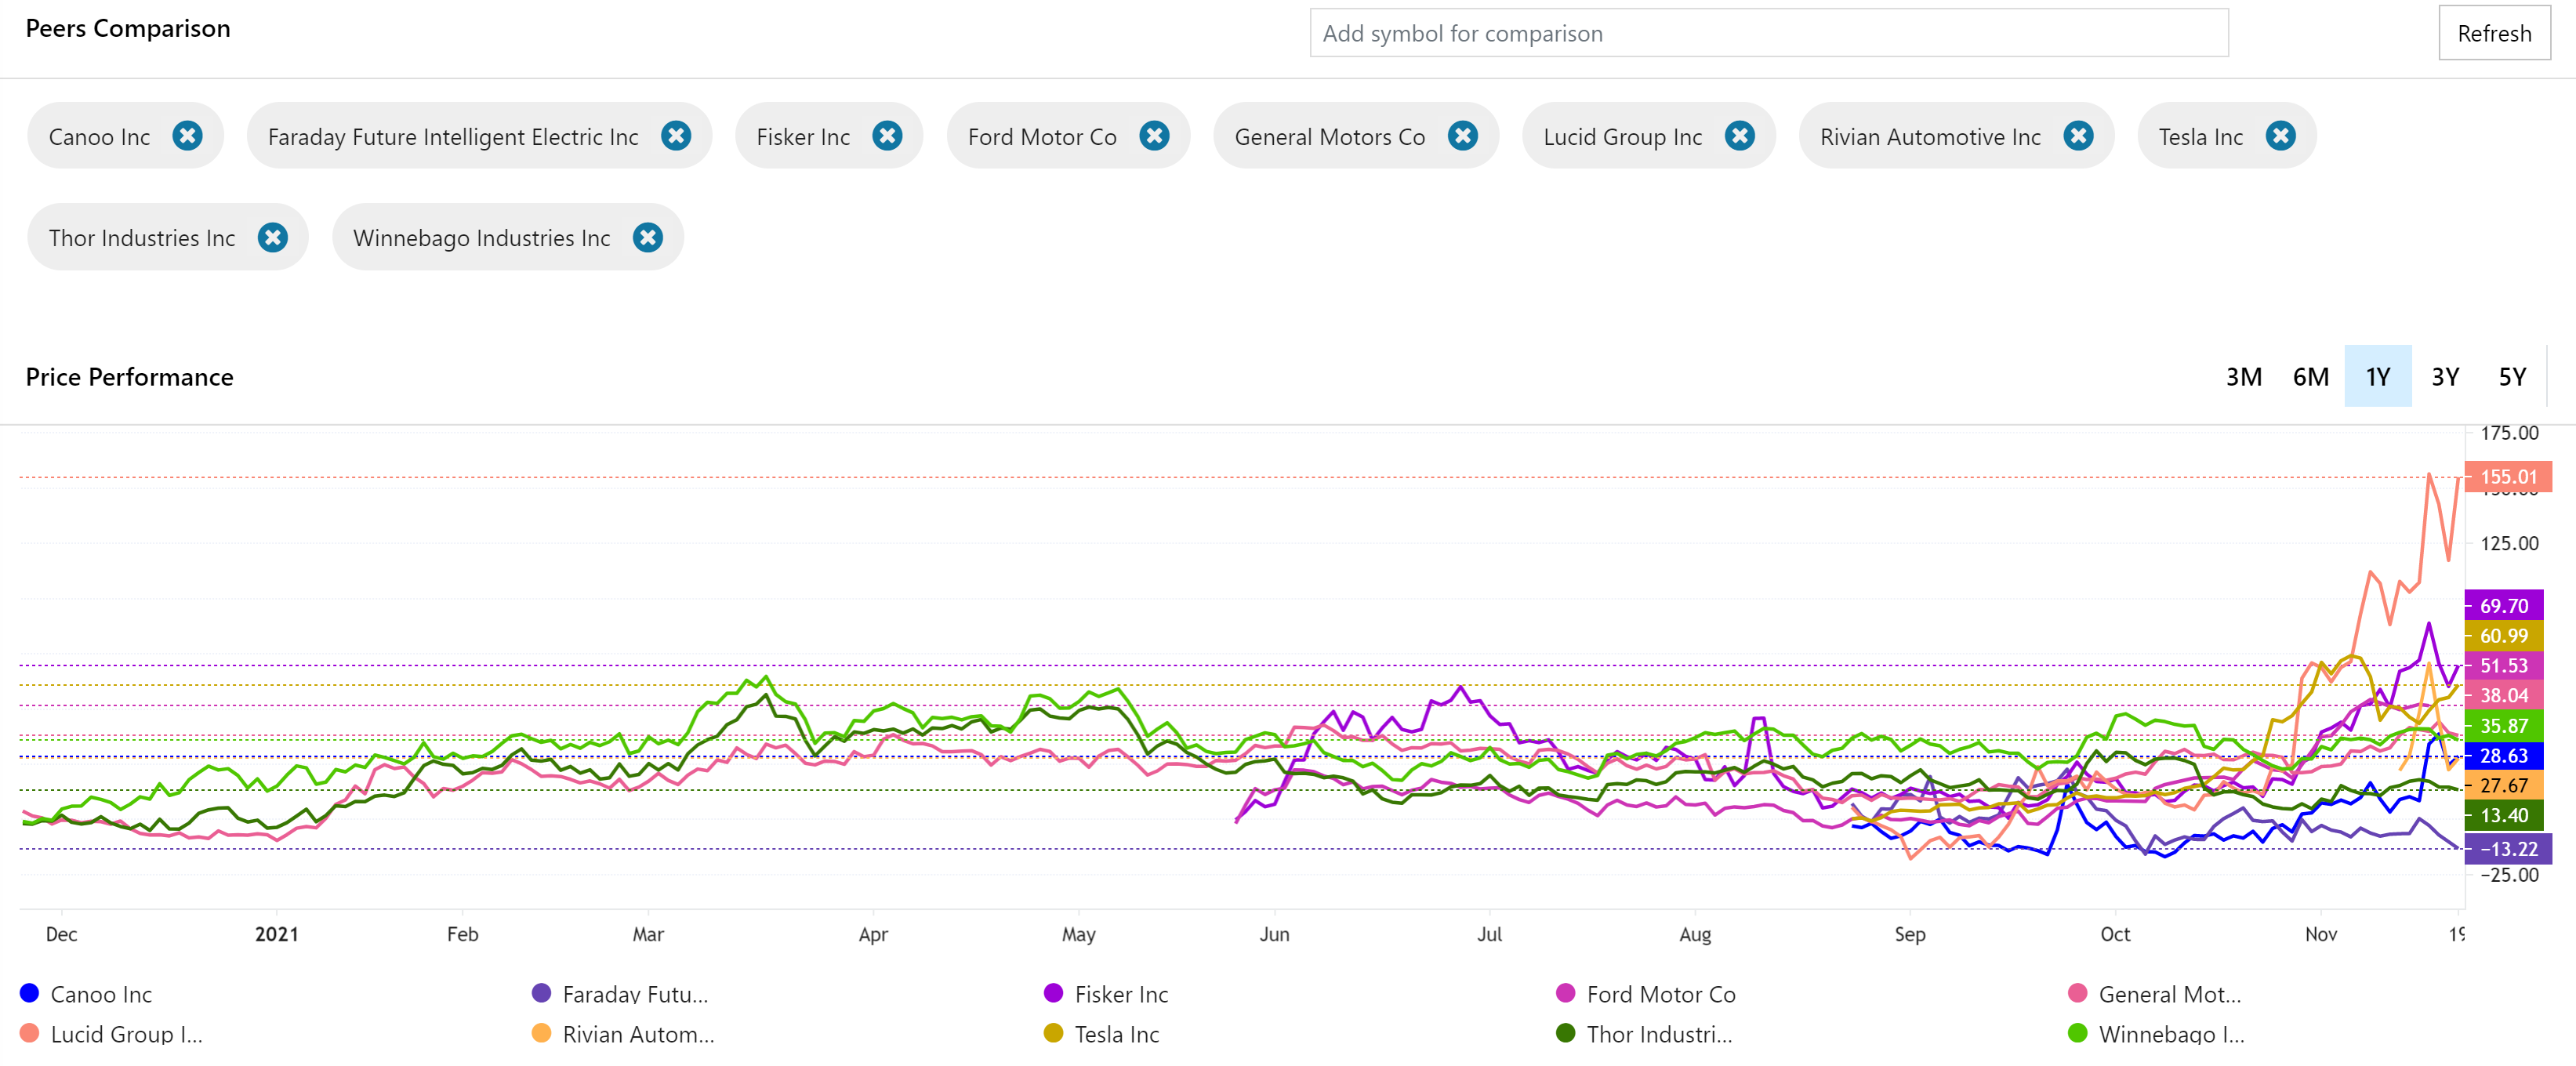
- The 'Peer Performance' graph compares the stock price performance of all related peer firms within an industry in a given time frame.
- For instance, "Peer companies" for TSLA (Tesla) which is in the automobile industry, would include firms such as Ford, GM, Lucid, or Rivian.
- These comparative insights could be insightful to traders and professional investors when deciding which companies to invest/ divest.
- Contains the company descriptor featuring basic information such as its headquarters location products, industry, and market segments.
- It also contains the fiscal year-end date (financial year) of the selected company, its ISIN code, SEDOL code, official website URL, and the date the company was officially listed on the exchange (IPO date).
Shows a range of financial ratios and metrics for the selected company in the financial areas of valuation, liquidity, efficiency, profitability, growth, and financial strength. These critical ratios serve as measures of a company's financial health and whether its success is sustainable in the long run. Analyzing these metrics while comparing them to the industry averages can help investors decide which stocks to invest in (undervalued stocks), and which ones to avoid (i.e. overvalued stocks could sometimes be a "bubble" waiting to burst).
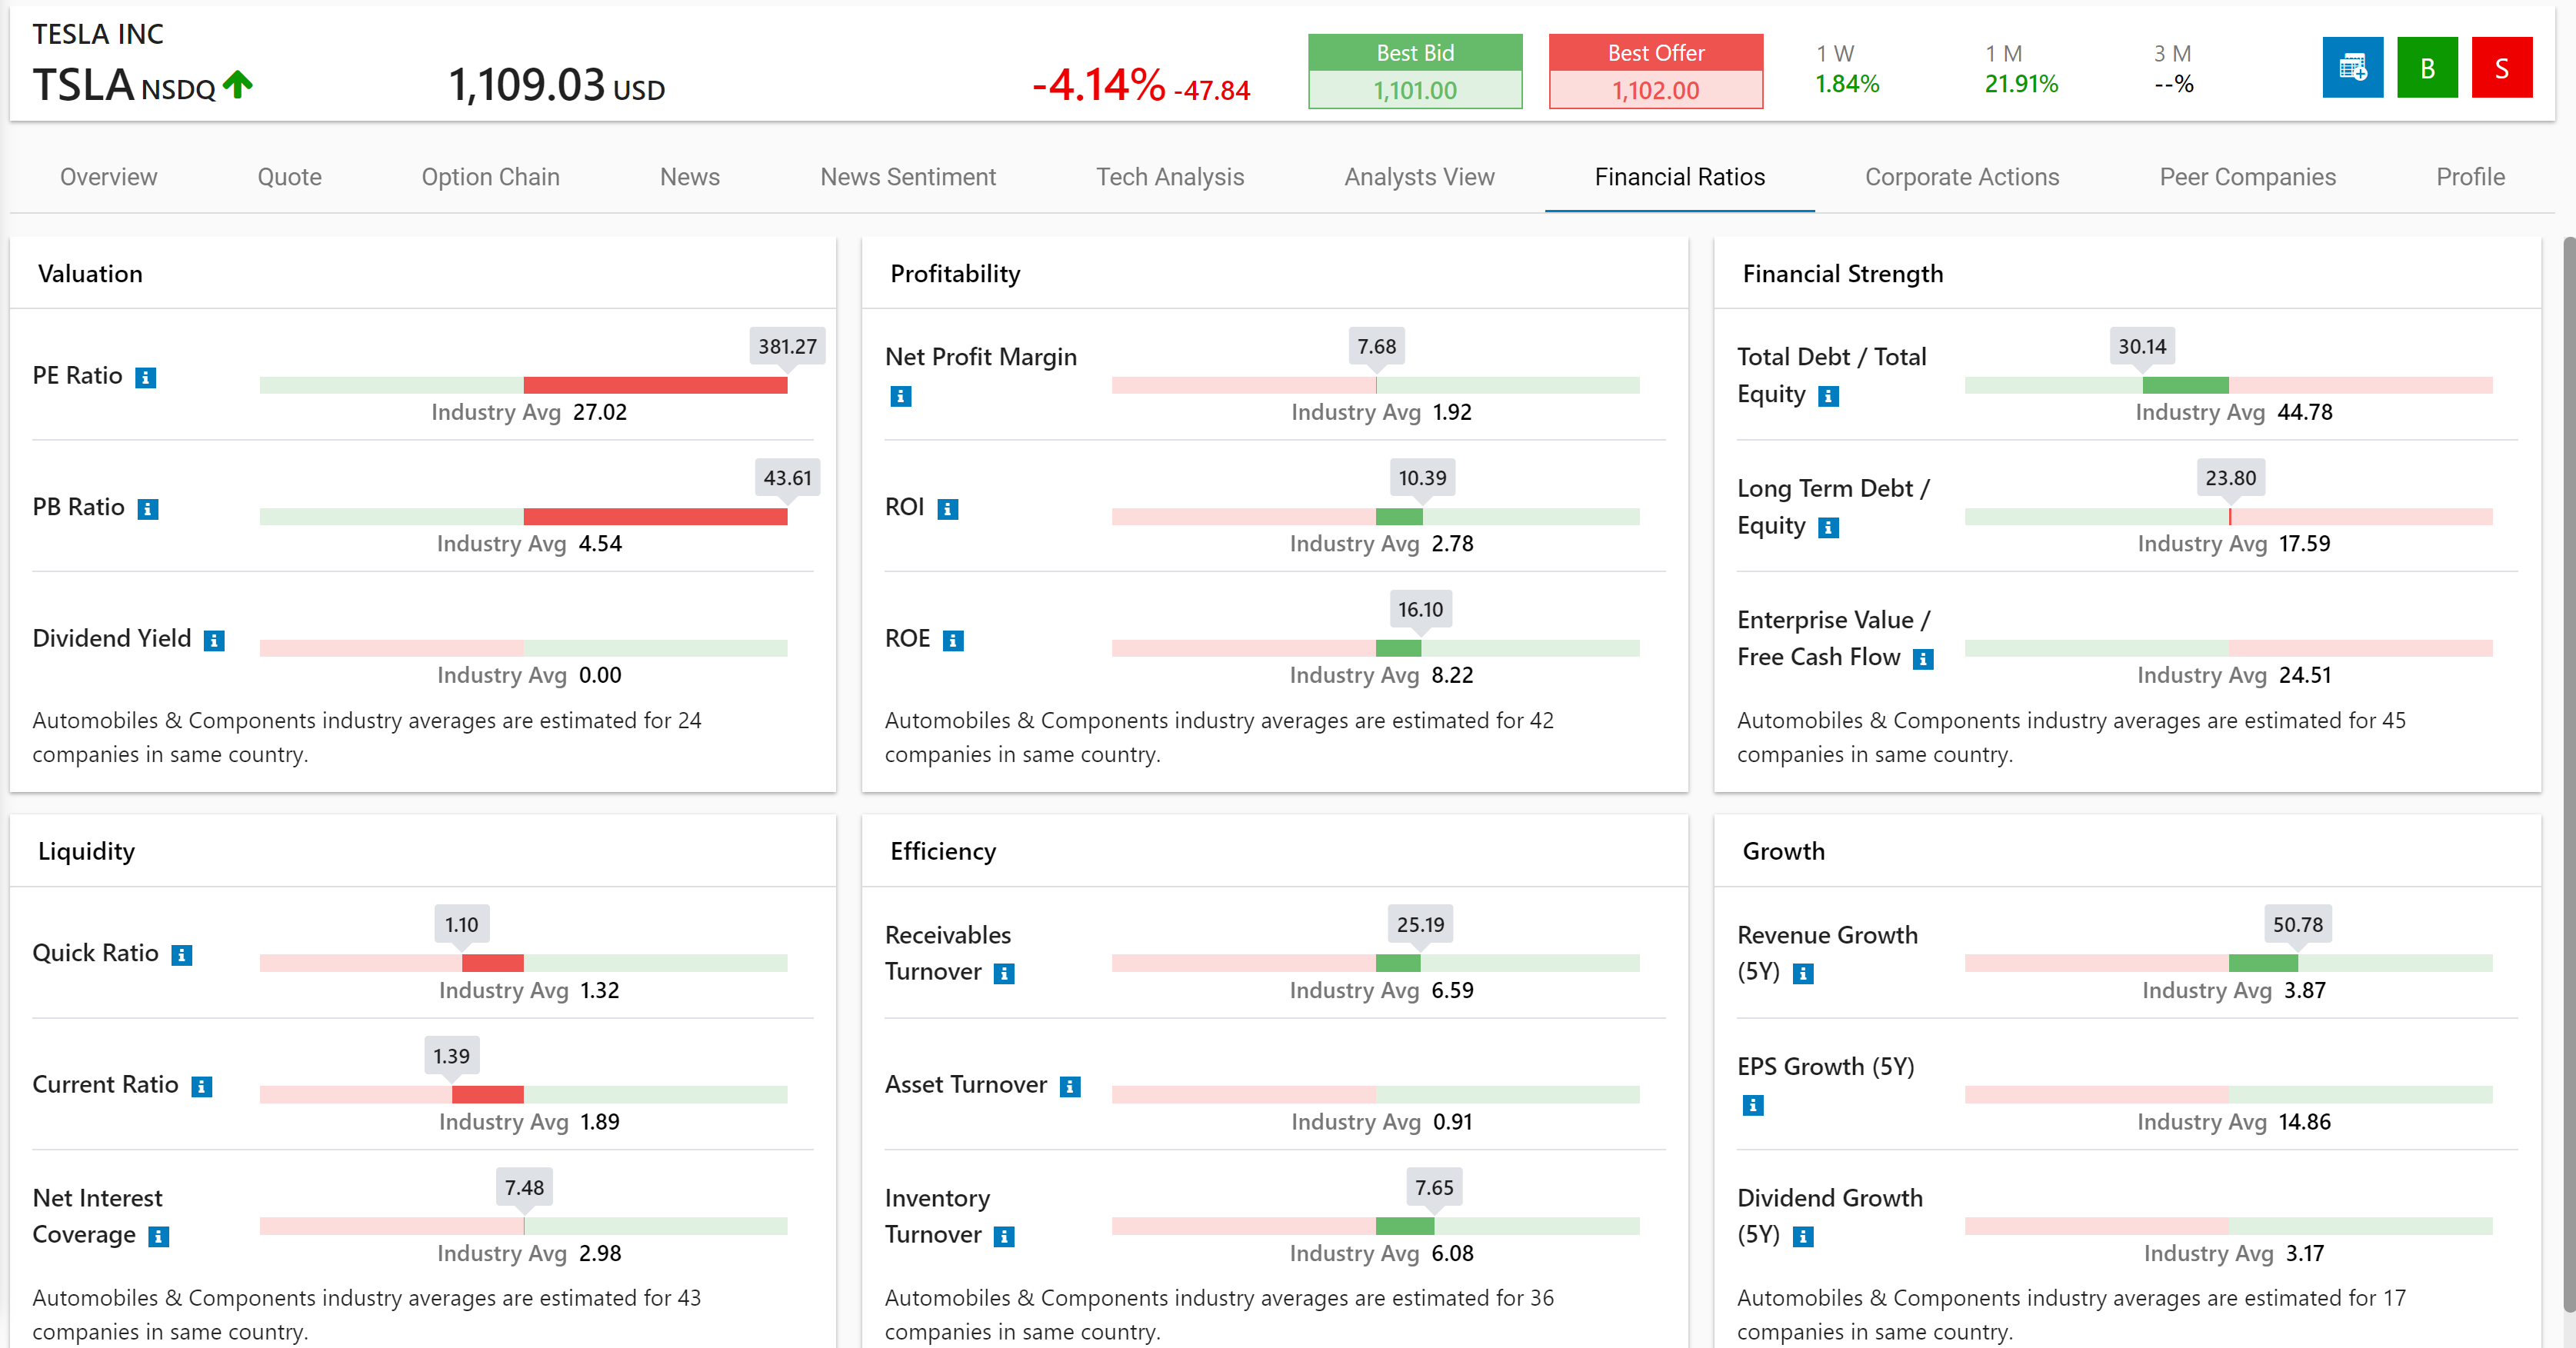
- Valuation
- Price to Earnings (PE) Ratio: The Price to Earnings (PE) ratio compares a company's current stock price to its earnings per share (EPS). This serves as a measure of whether a stock is undervalued or overvalued (This can be confirmed further with the PB ratio). A lower PE ratio is considered better as it indicates the stock veers more towards being undervalued than overvalued.
- Price to Book (PB) Ratio: The Price to Book (PB) ratio compares a company's current stock price to the quarterly book value per share. This can be used as a confirmation of a PE ratio, as a PB ratio can help investors avoid companies that are overvalued. A lower PB ratio is considered better as it indicates the stock veers more towards being undervalued than overvalued.
- A PB ratio value of 1.0 indicates the company's share price is proportional to the value of its assets on the balance sheet. A low PB ratio value (below 1.0) could be an indication that a company's shares are trading at a lower price relative to the value of its total net assets on the balance sheet. In contrast, a high PB value (above 1.0) could be an indication that a company is overvalued as is trading way above the value of its total assets on its balance sheet.
- The PB ratio could inflate or deflate due to factors in the company's business environment. For instance, good or bad news regarding the company in the press (i.e. news sentiment), or management actions can affect the PB ratio. Larger gaps between the PB ratio and Return on Equity (ROE) are usually a red flag to investors to avoid a stock purchase.
- Profitability
- Net Profit Margin: A financial ratio that compares the company's net income to its total income (or revenue). It is an important indicator of a firm's financial health as it measures how efficient a firm is at converting sales into profits (i.e. the financial and cost management of a firm). A higher score than the industry average is considered better.
- ROE (Return on Equity): A measure of how efficiently a company is using shareholder's equity to generate profits (Net income/ shareholder's equity). A higher score than the industry average is considered better.
- ROI (Return on Investment): A measure of how efficient a company is at using total investments to generate profits. A higher score than the industry average is considered better.
- Financial Strength
- 'Total Debt / Total Equity' (Debt-to-Equity Ratio): Serves as a critical indicator of a company's financial leverage as it measures to what extent a company finances its operations via debts vs actual equity (calculated by dividing total liabilities by shareholder's equity). A lower ratio is considered better as it shows the company is financed less with debt and more with equity.
- 'Long Term Debt / Equity': The Long-term Debt to Capitalization ratio compares long-term debt while taking into account the firm's shareholder's equity. This serves as a good indicator of a firm's financial leverage as it measures the extent to which long-term debt instruments are used to finance its operations/ assets. A lower ratio is considered better as it shows the company is financed less with debt and more with equity (in the long-term).
- 'Enterprise value / Free Cash Flow': Enterprise Value to Free Cash Flow serves as an indicator of the value of a firm and its ability to generate smooth cashflow. A lower ratio is considered better (i.e. the lower the ratio, the faster a company can generate cash for reinvestment).
- Liquidity
- Current Ratio: Serves as a measure of a firm's ability to settle its short-term financial debt obligations using its short-term assets. A higher score than the industry average is considered better.
- Quick Ratio: Serves as a measure of a firm's ability to meet its short-term debt obligations using cash or near-cash assets (excluding inventory). It is considered more stringent of a test than the current ratio as it doesn't include all current assets. The goal of the quick ratio is to measure the company's ability to settle its short-term debts with its most liquid assets. A higher score than the industry average is considered better.
- Net Interest: Measures a firm's ability to pay interest to account holders using earnings (income). It compares the net interest incomes (i.e. from loans/ mortgages) with the interest payments that it pays to savings accounts holders. This is applicable more in financial services firms such as commercial or investment banks. A higher score than the industry average is considered better.
- Efficiency
- Asset Turnover: The Asset Turnover Ratio measures a firm's ability to generate revenue (or sales) using its assets. This can tell investors how efficient a company is at utilizing its asset to generate revenue streams. A higher score than the industry average is considered better.
- Inventory Turnover: This serves as an indicator of how many times a company has had to replenish its inventory as a result of sales during a given period. It can provide an idea of how fast goods move (are sold and are converted to cash) within a firm that stocks inventory. A higher score than the industry average is considered better.
- Receivables Turnover: Serves as an indicator of how good/ efficient a company is at collecting accounts receivable (converting debts owed to them by customers or others into cash). It is calculated by getting the average value for accounts receivable. A higher score than the industry average is considered better.
- Growth
- Revenue Growth: Measures the average revenue growth rate of the firm over a 5 year period using the industry average as a reference point. A higher score than the industry average is considered better.
- EPS Growth (5Y): Measures the growth rate of EPS (Earnings Per Share) over a 5 year period. The industry average is used as a reference point. A higher score than the industry average is considered better.
- Dividend Growth (5Y): Measures the growth rate of a company's dividend payments (to investors) over a 5 year period. The industry average is used as a reference point. A higher score than the industry average is considered better.