Portfolio
Click on the  icon in the workspace. Select the Trading tab from the side menu, then click on Portfolio.
The Portfolio provides a real-time graphical overview of the portfolio and its performance; i.e. the profit/ loss generated from the securities (i.e. stocks) contained in one portfolio. Portfolio performance is analyzed from multiple perspectives including fundamentals (like financial ratios). It also provides a live real-time valuation of the user's securities based on their current market value, and their initial purchase price.

- You can select the Account (s) you wish to analyze from the dropdown at the top of the screen (selecting 'All' will analyze the performance of all accounts and their constituent securities as a whole).
- Selecting a Portfolio will automatically load the performance metrics associated with it.
- You may also select the preferred Valuation Currency from the drop-down.
Portfolio page contains following sub sections.
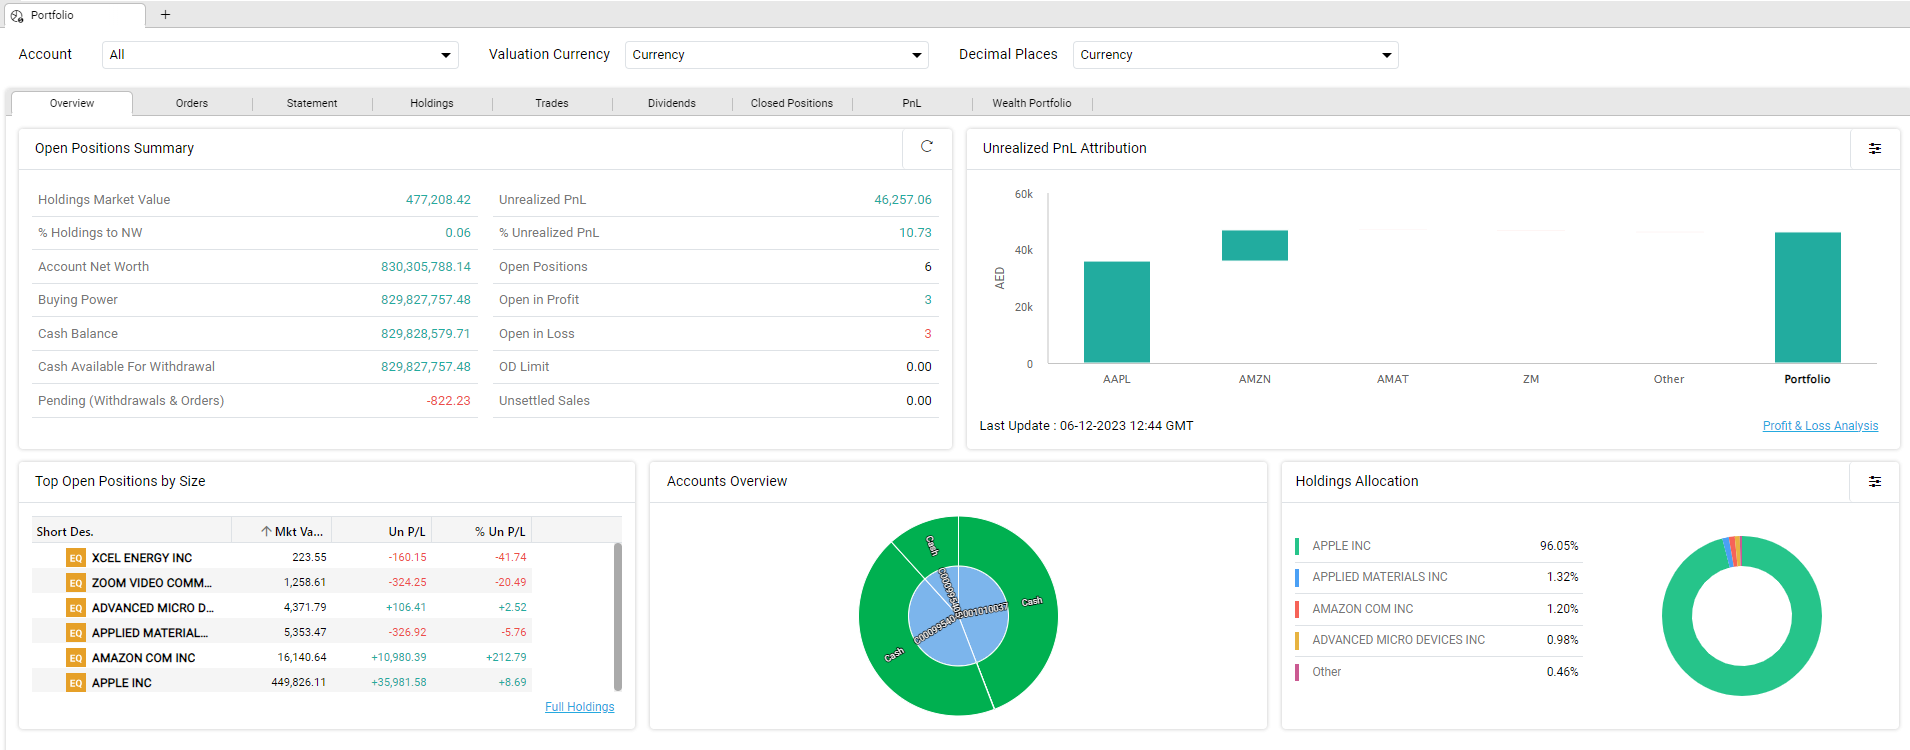
The overview tab contains multiple graphical widgets providing an overview of the following portfolio performance metrics.
- Open Positions Summary – This section displays the real time summary of the open positions.
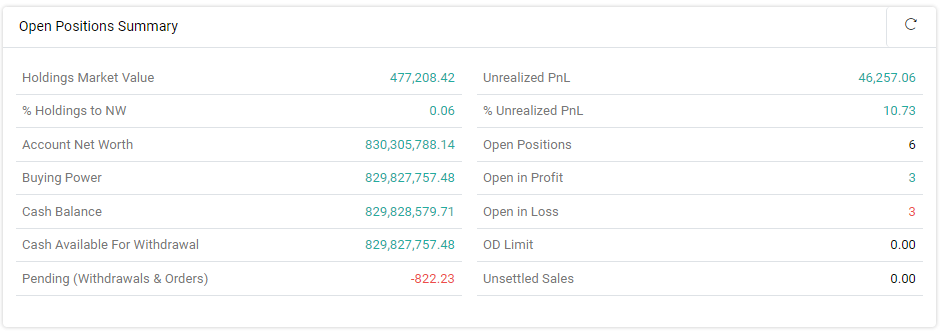
You can use the  refresh button on the top right hand corner to get the latest values.
- Unrealized PnL Attribution –Represents profit and loss based on the difference between the average entry price and the mark price. Click
 to view the results by “%” and by “value“.
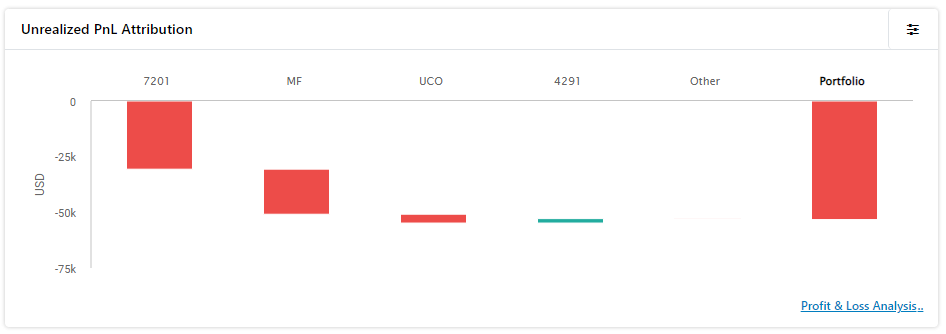
Note: Clicking on the 'Profit & Loss Analysis' icon located at the bottom right corner of the Unrealized PnL Attribution, will redirect to the PnL tab.
- Top Open Positions by Size –Displays the top open positions based on their size. You can sort the data by clicking on the relevant column you wish to sort them by.
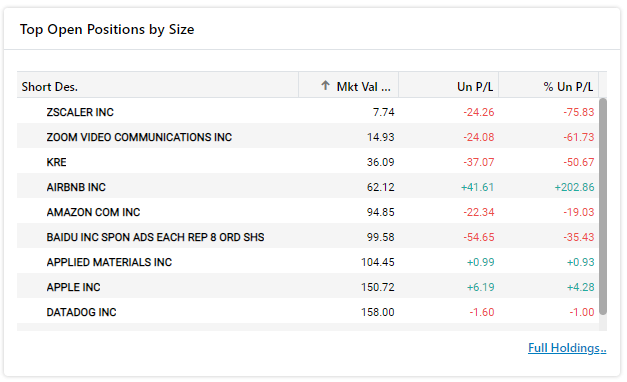
Note: Clicking on the 'Full Holdings' icon located at the bottom right corner of the Top Open Positions by Size, will redirect to the Holdings tab.
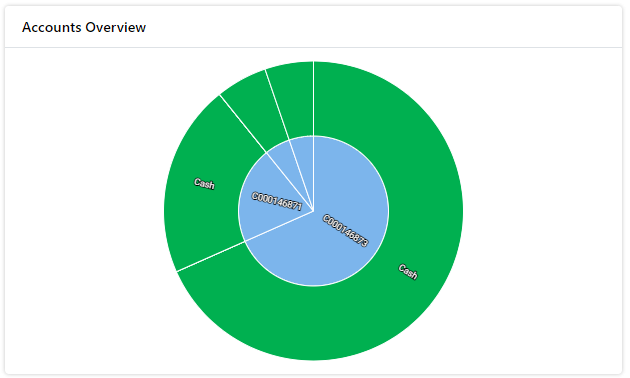
- Accounts Overview – You can hover the mouse over on the relevant sector to view it's value.
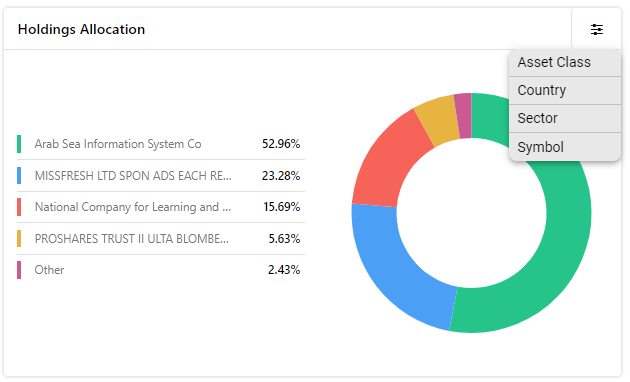
- Holding Allocations – This graphical dashboard widget represents the percentage value of holdings. Click settings to view holdings allocations by Industry or Country (you may switch back to the default Holdings view from another view).
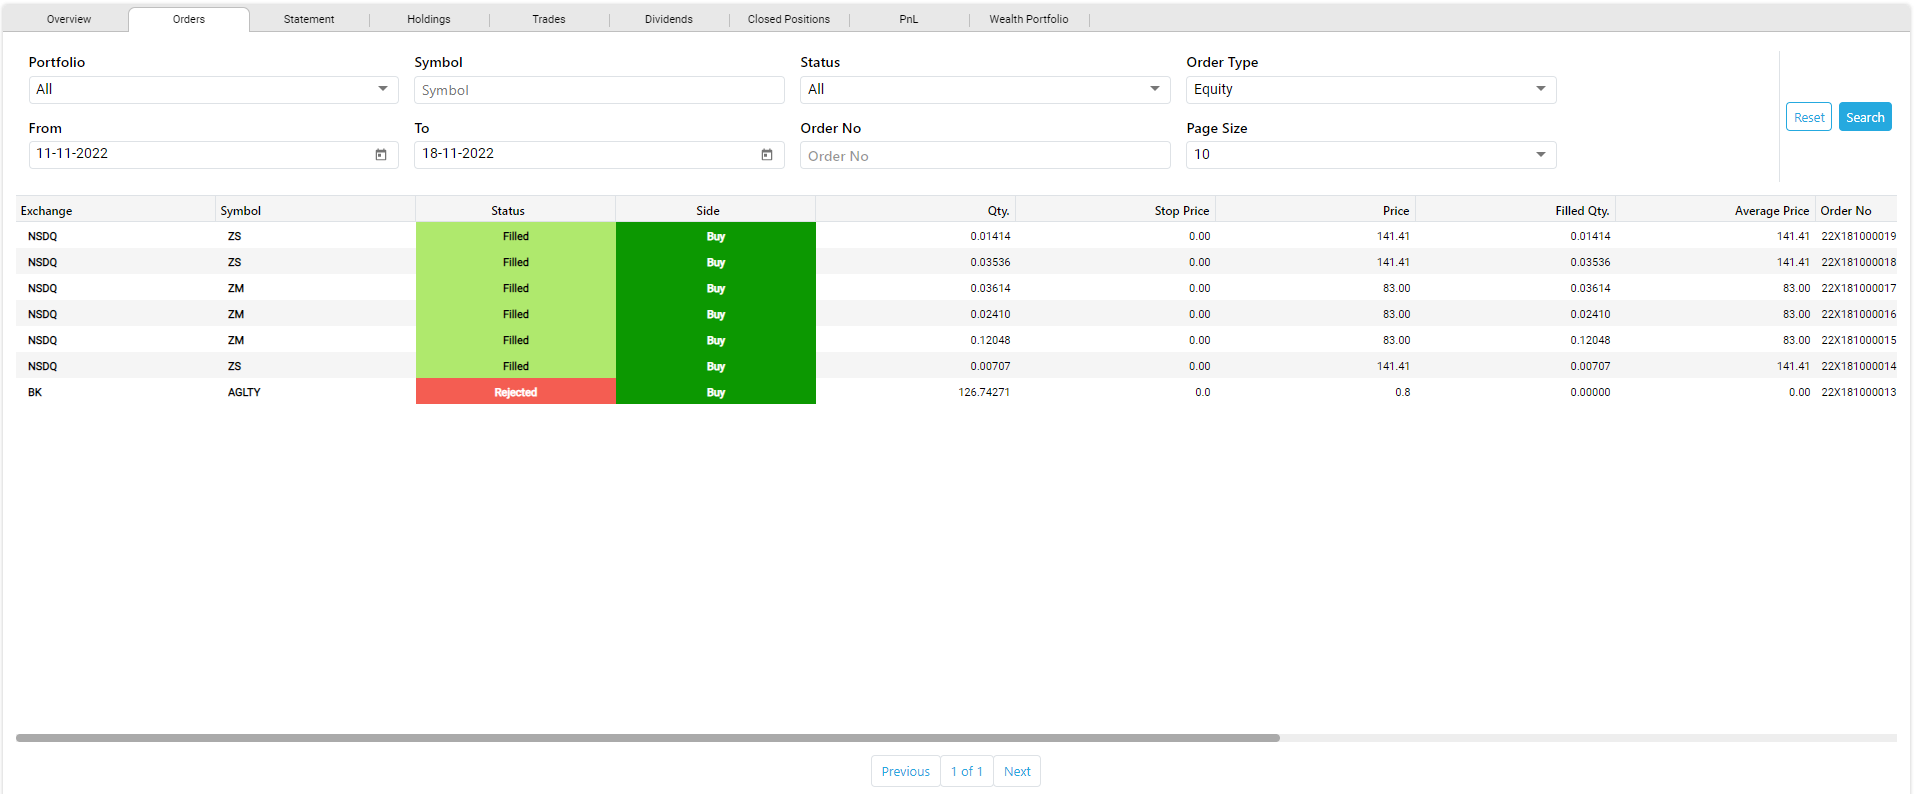
Using this section, orders can be filtered based on a range of user-specified criteria.
- For instance, orders can be filtered by: orders for a particular Symbol, that are of a specific Order Type, by status, or by Date Range.
- Once the criteria have been specified click on the Search button to search.
- To gain a comprehensive view of an Order, simply click on an Order; A window will then open displaying a range of order details.
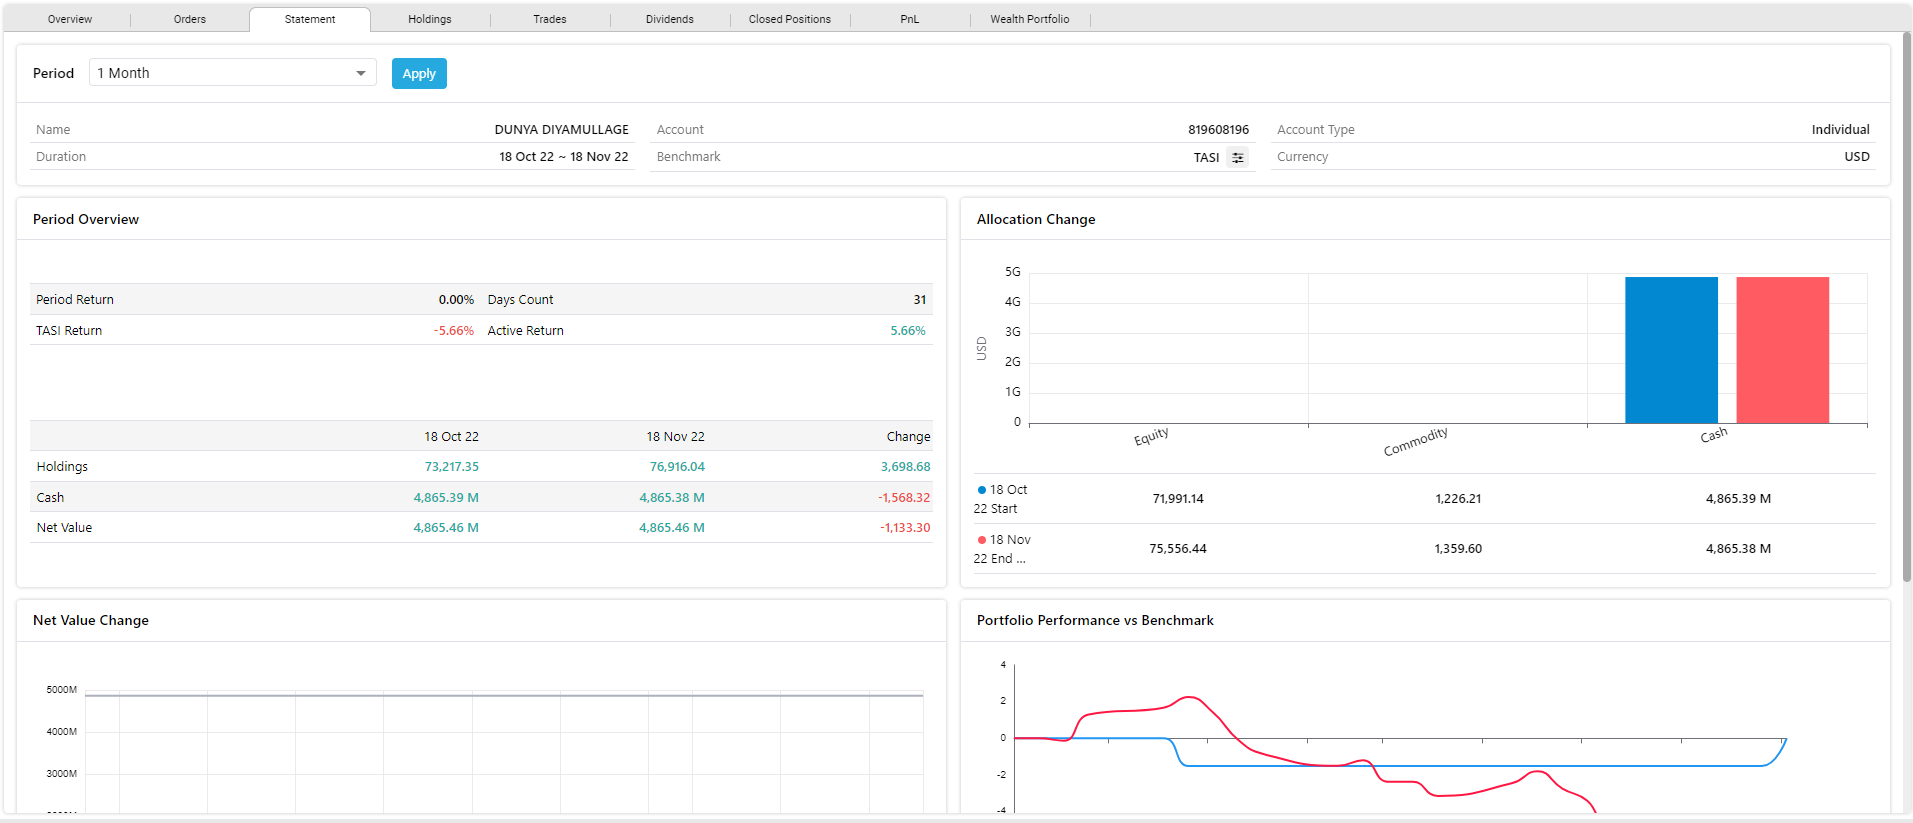
- Statement tab displays Period Overview, and graphical representations of Allocation Change, Net Value Change and Portfolio Performance vs Benchmark. Select the Period you wish view the data and click on Apply.
- Using this section, you can create customized statement. Scroll down to the bottom of the page and go to the Account Statement section. Select the Portfolio, Statement Type and Period, then click on the
 button to download the statement report.
Using the holdings tab, you can view details related to the holdings including top holdings based on ticker, country and asset class.
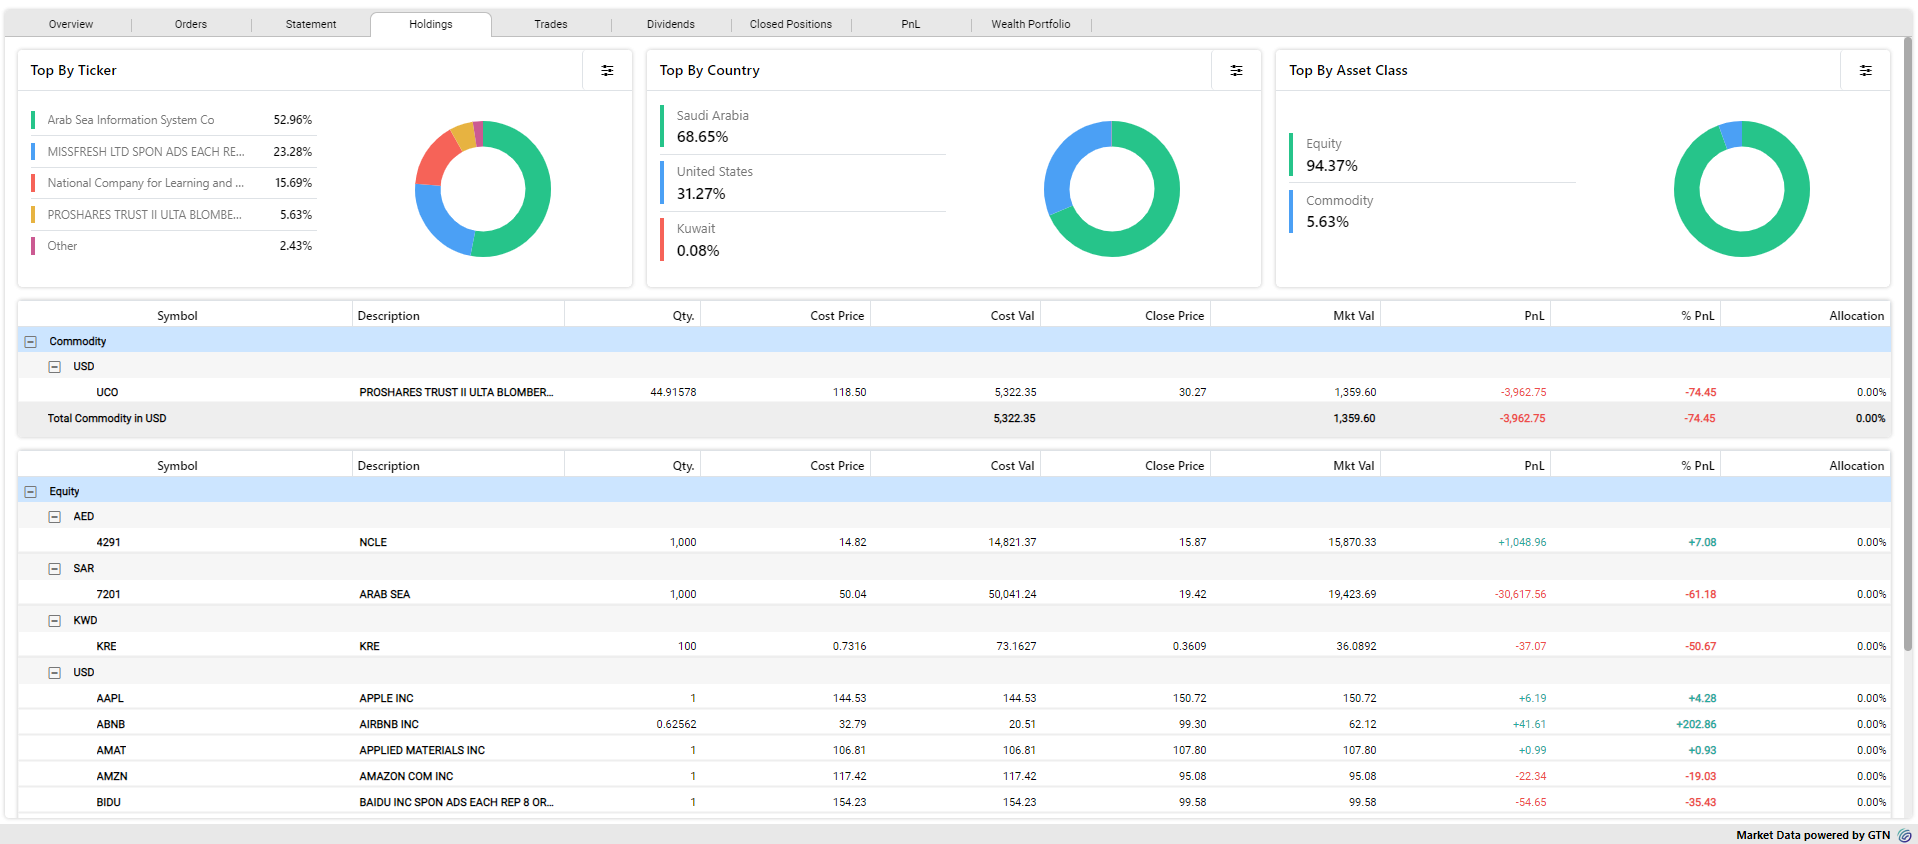
Note: You are able to view the values in symbol currency for the selected columns in the portfolio.This is only applicable for CFD and FX only.The relevant column values are displayed in the symbol currency for FX & CFD. The currency selected from the currency drop-down values can be changed according to the selected currency for the other columns in FX & CFD.
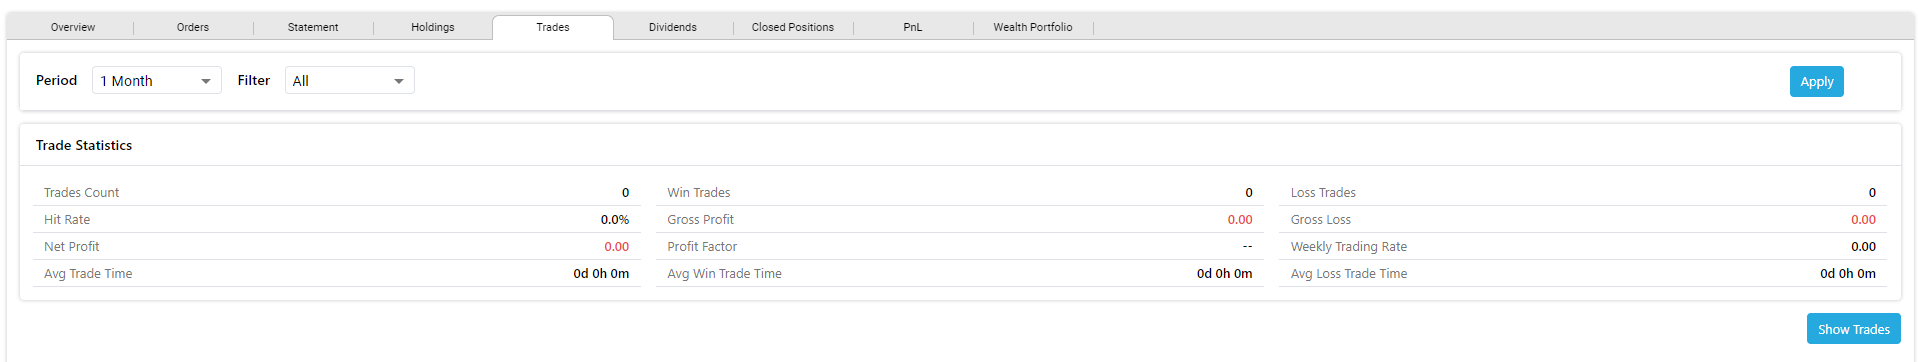
Trades tab displays trade statistics.
- Select the Period, and Filter from the drop downs and click on Apply.
- Then click on
 button to view the trades.
The Dividends tab provides a detailed analysis for dividends. This feature also allow you to filter the data based on the time period.

The Closed Positions tab allows a trader to search for orders, based on Portfolio, Symbol, Date, and P/L Value (I.e. whether symbol Closed in Profit / Closed in Loss). The Closed Positions window displays the list of symbols that have been bought and sold. It also displays the profit and loss of the trades that have occurred in the past.
- You may filter the Closed Positions list by Portfolio, by Symbol, Date range, P/L attribution, or by Type (i.e. by individual transaction execution or by order).

Exporting Closed Positions data to Excel
- You can also export the closed positions list to an Excel sheet in order to support offline data analysis in the future.
- To do so, simply click the Export to Excel button located at the top right-hand corner of the window.
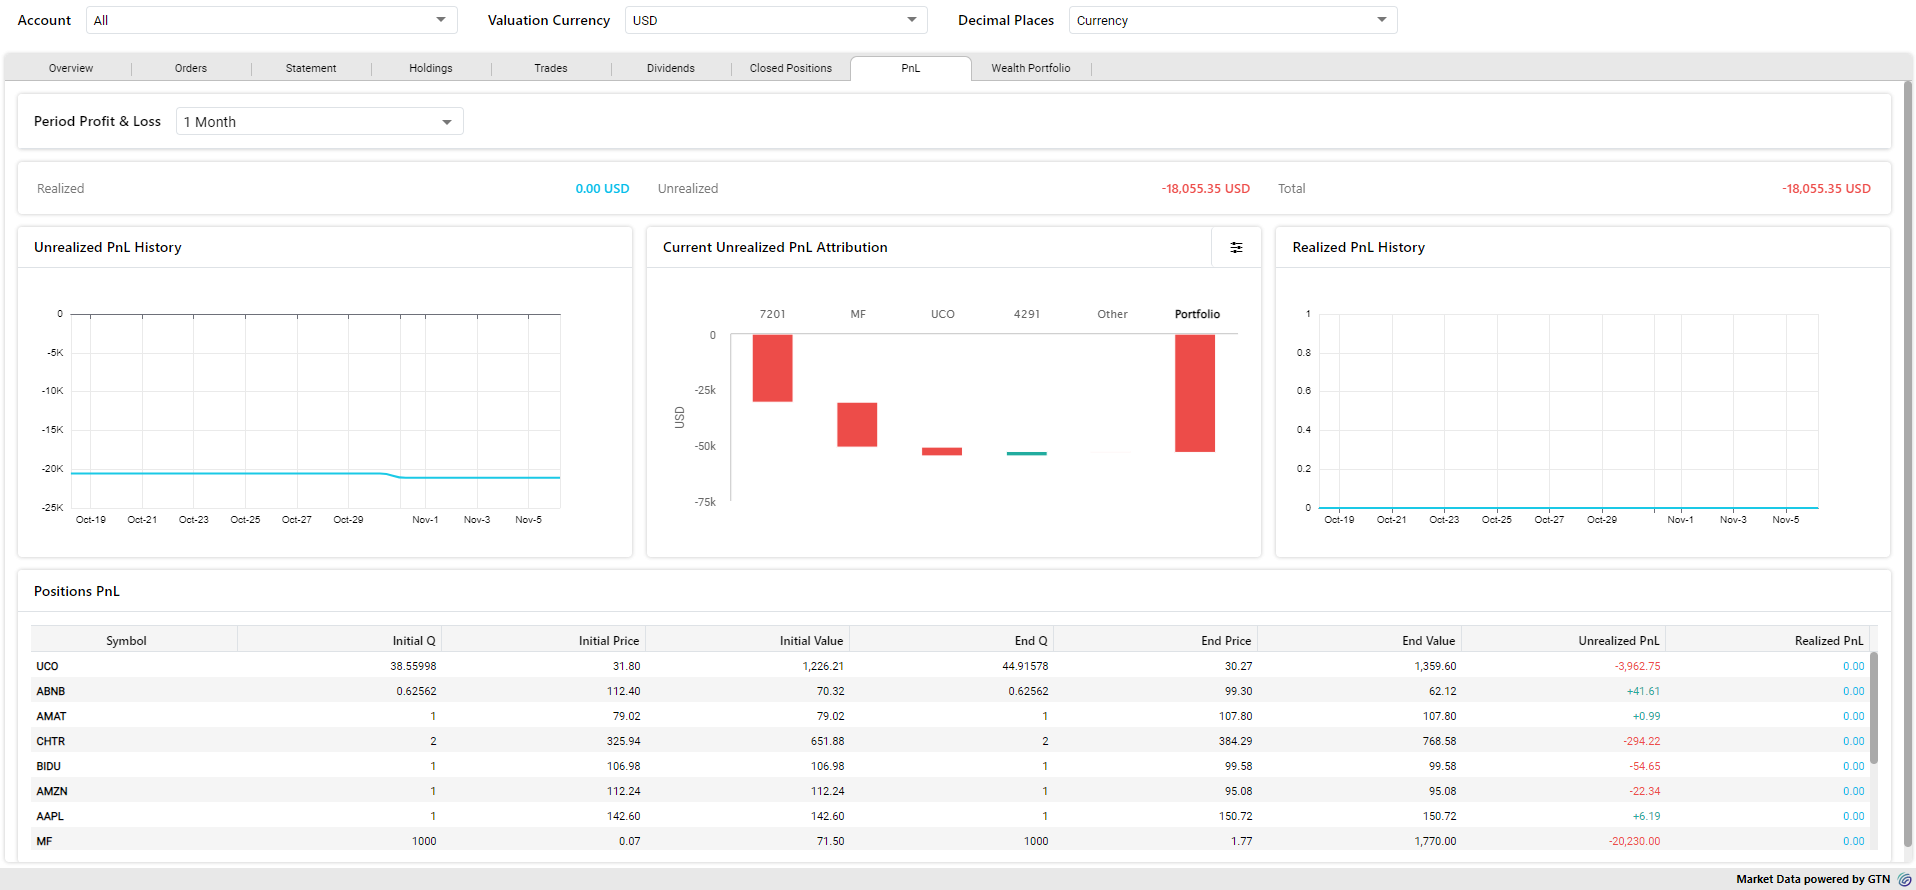
Using the PnL tab, you can get a detailed analysis of the profit and loss including realized and unrealized PnL History, Current Unrealized PnL Attribution, and Positions PnL.