Trading Console
Upon logging in to the application, you are greeted to a screen resembling the following layout. This section aims to provide you with a quick walkthrough of the core components required to operationalize your trading and investment activities.
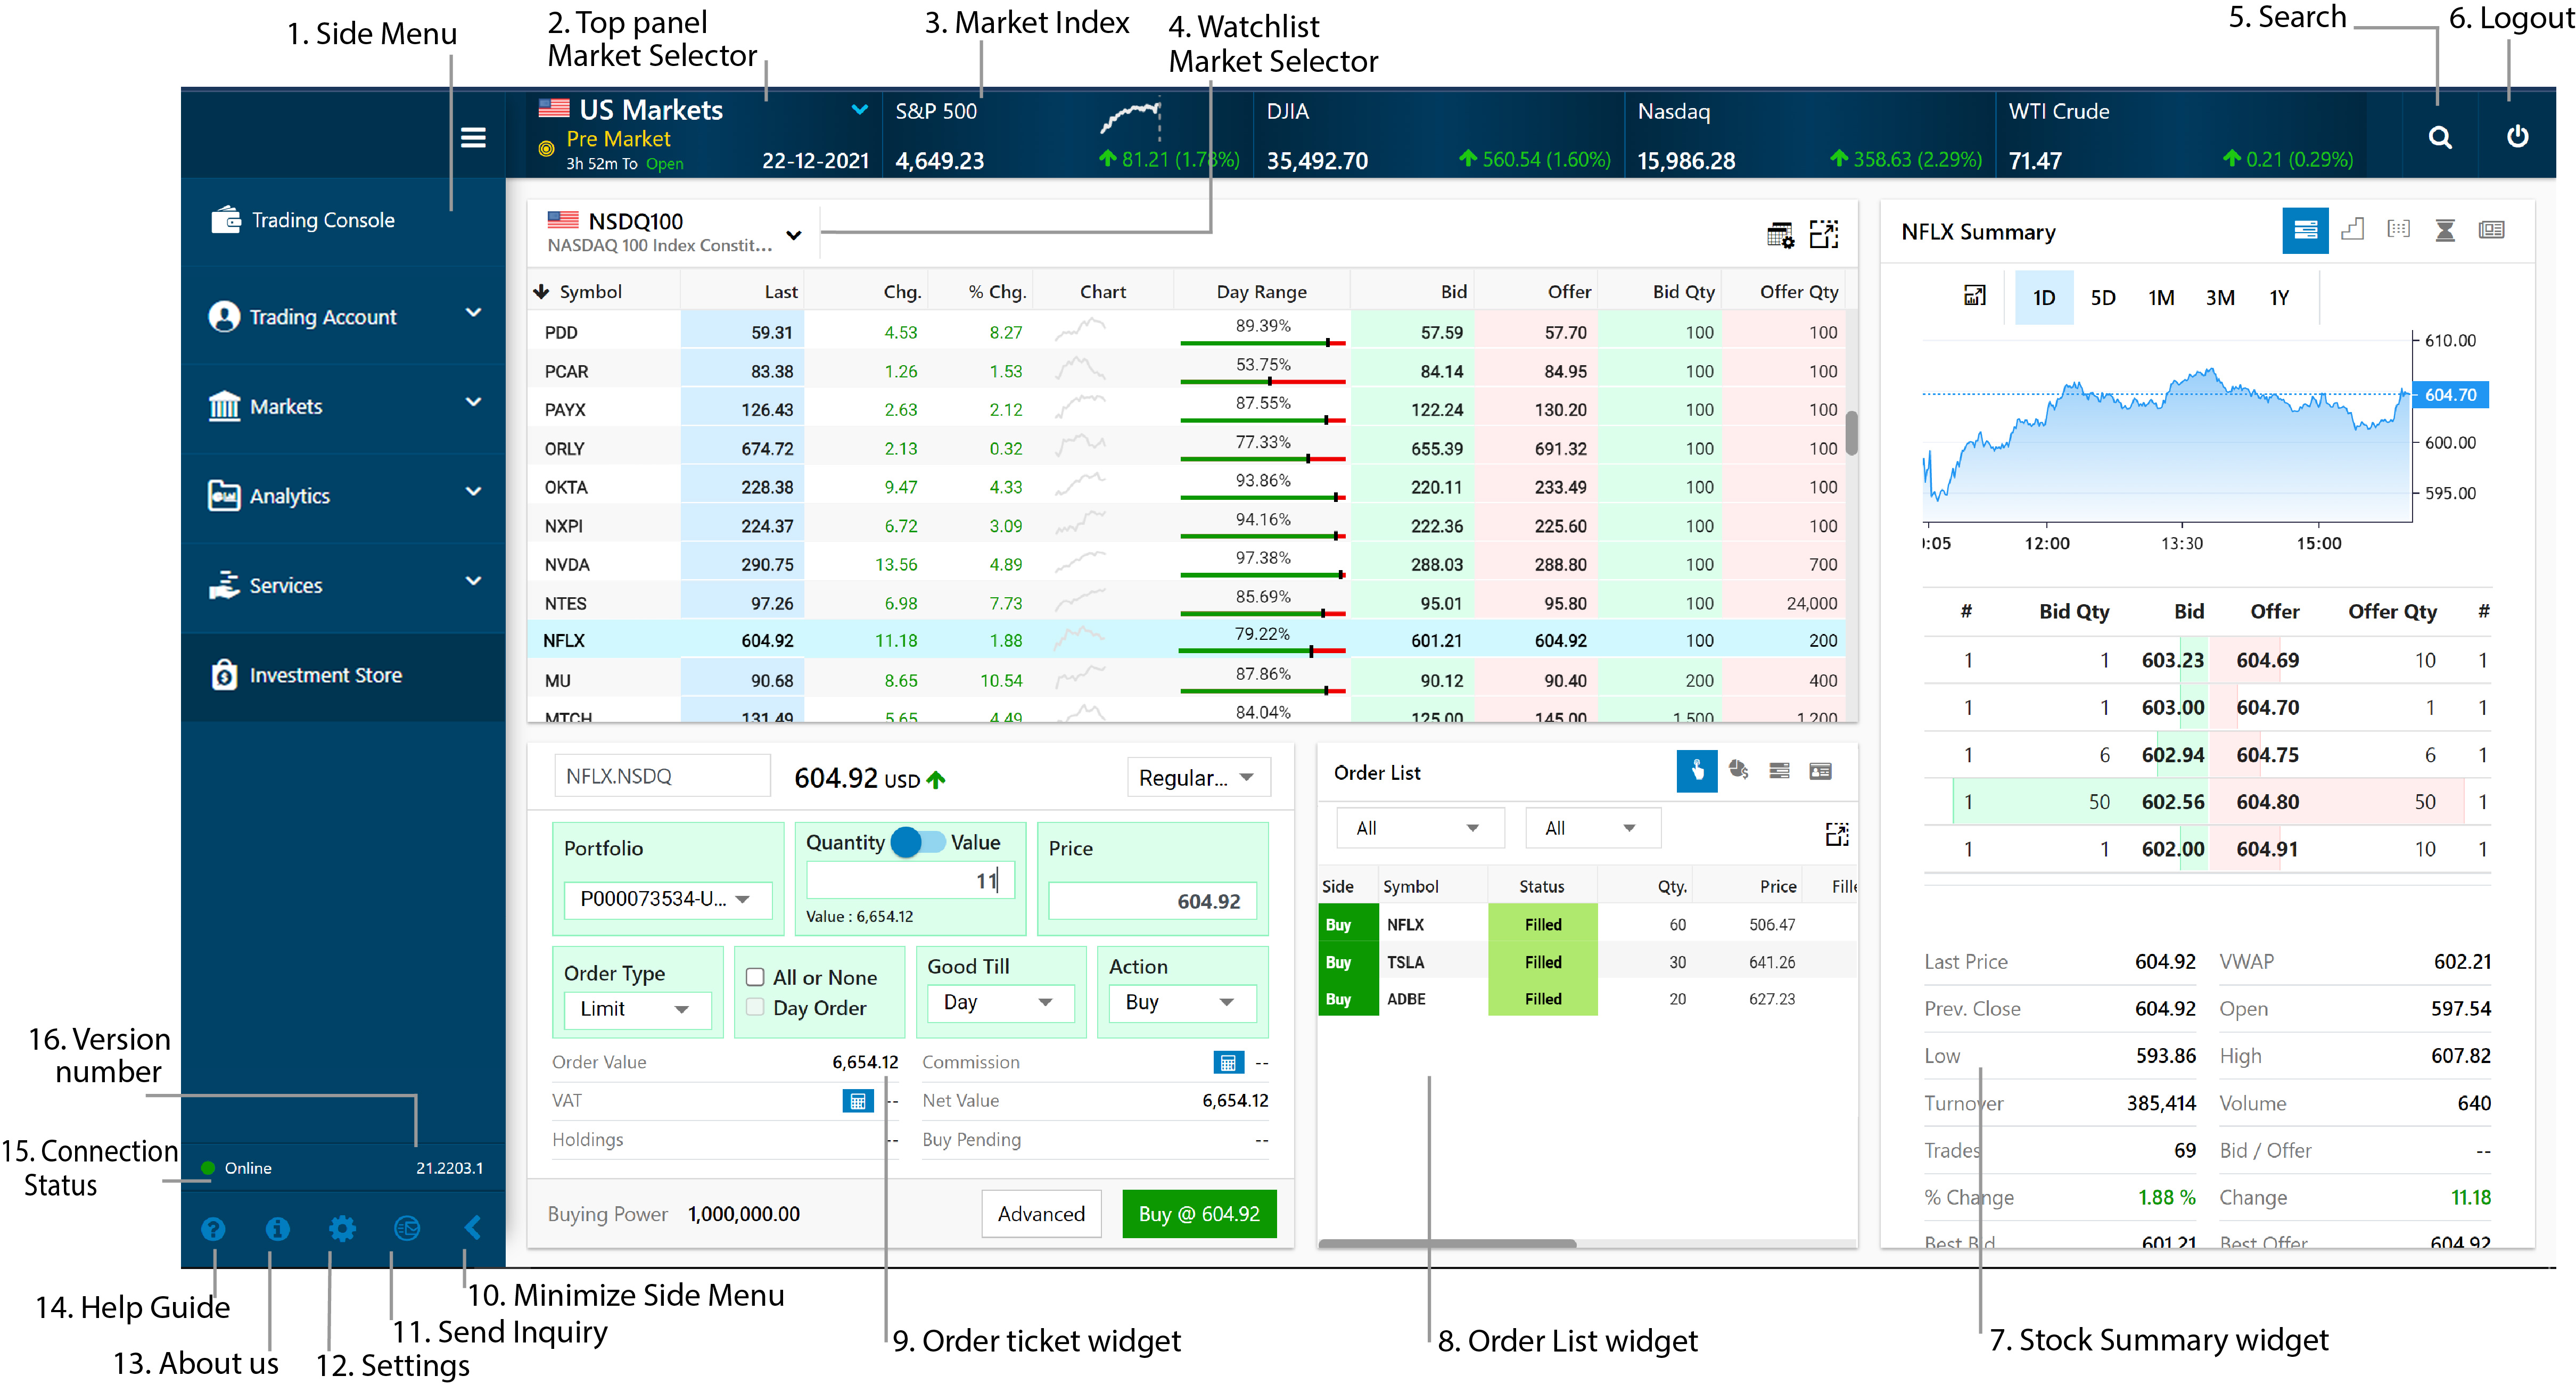
1. Side Menu
- The side menu serves as the central access point to the major functional areas of the app including the Trading Console, the Trading Account, Market, Analytics, Services, and the Investment Store.
2. Top Panel - Market Selector
- The market selector dropdown located on the top panel can be used to change the market information displayed on the top panel and the market indices associated with it. (See section 3 on Market Index).
- The selected market card displays the market status, the market time (or its time to open), and the date in the selected market. Holidays in the selected market will also be displayed where applicable.
- Note: The market statuses displayed and the speed of updates to indices would depend on the user's subscription.
- Market Statuses can be as follows:
- Pre-Open
- Open
- Closed
- Post-Market Trading
3. Top Panel - Market Index
- A color-coded arrow will be displayed alongside each market index displayed on the top panel.
- A green arrow
 indicates that overall, the stocks contained within that market index are displaying an upward price movement/trend compared to the previous trading day.
- A red arrow
 indicates that overall, the stocks contained within that market index are displaying a downward price movement/trend compared to the previous trading day.
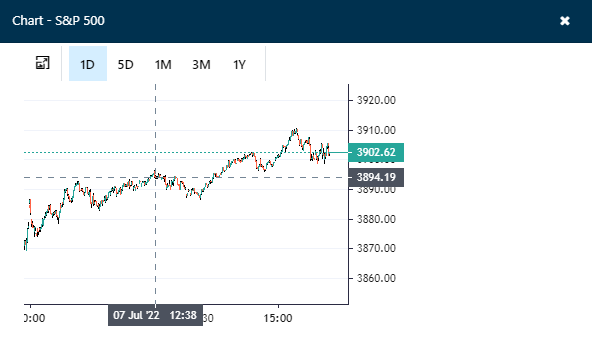
- Clicking on a 2D index chart (alongside a market index in the top panel) will open a full-scale chart view of the selected market index (depicted below).
US Markets - Top Panel

- The cards to the right of the market status card display a range of market indices available for the US Markets.
- If the 'US Markets' option is selected from the top panel, then the following US Market Indices will be displayed (by default):
- S&P 500
- The Dow Jones Industrial Average (DJIA)
- Nasdaq
- Crude Oil
- Gold
- To change/customize the US market indices that are displayed on the top panel, simply move your mouse pointer towards the top right-hand corner of the top panel, then select the settings icon
 that appears upon mouseover.
 - Alternatively, these can be also customized by navigating to the Settings page, selecting the Display tab, clicking on Top Bar Index and then adding the preferred indices under the 'US Top Panel Preferences' widget.
- Note: Apart from indices, you may also add commodities (i.e. Gold, Silver, etc.) to the US top panel index list.
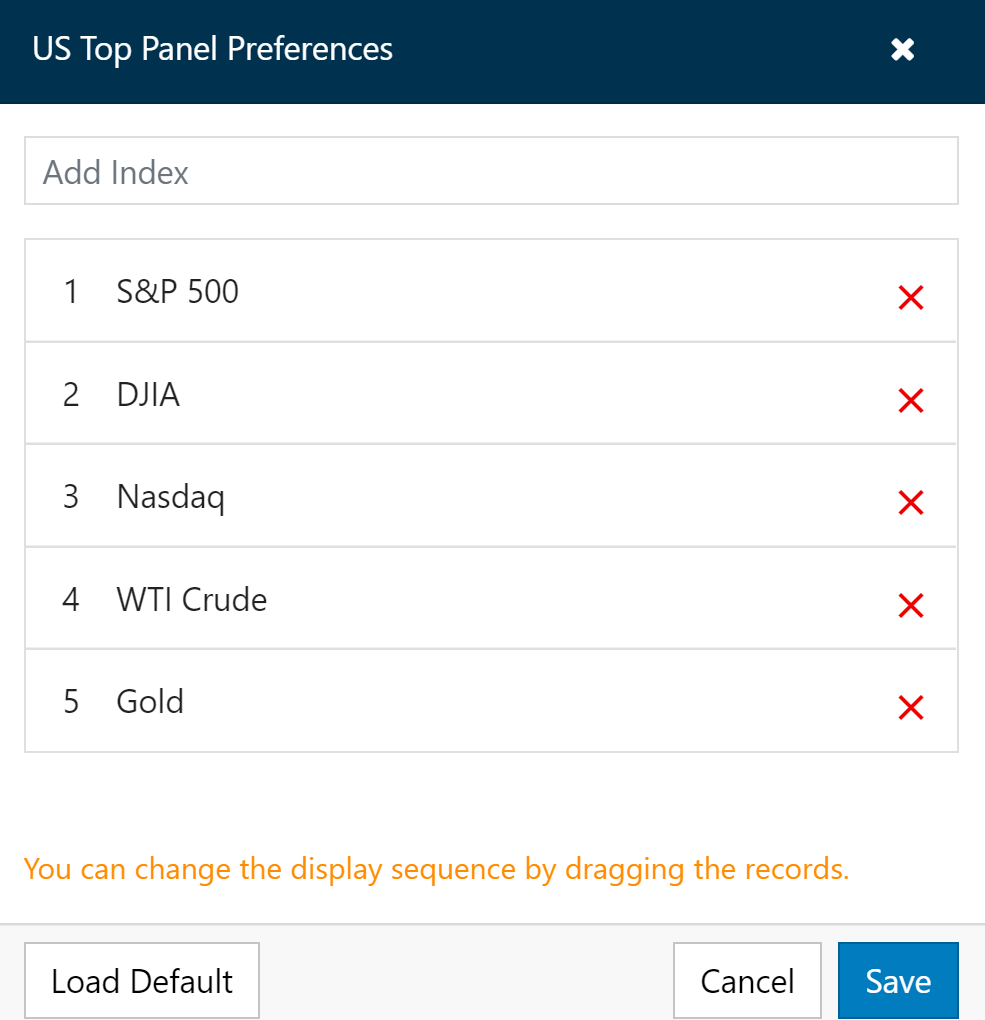
- Note: This feature is not available for Egypt and BHM-UAE customizations.
- To add an index or a commodity, simply type in the name of the index/commodity you wish to add in the 'Add Index' search field, then select it as it appears in the autocomplete list and press Save.
- A maximum of seven such indices or commodities can be added to the top panel.
- These seven indices can be rearranged in any sequence simply by dragging and dropping them to your preference.
- Clicking on "Load Default" will reset the list of indices to the above (pictured) list of default indices.
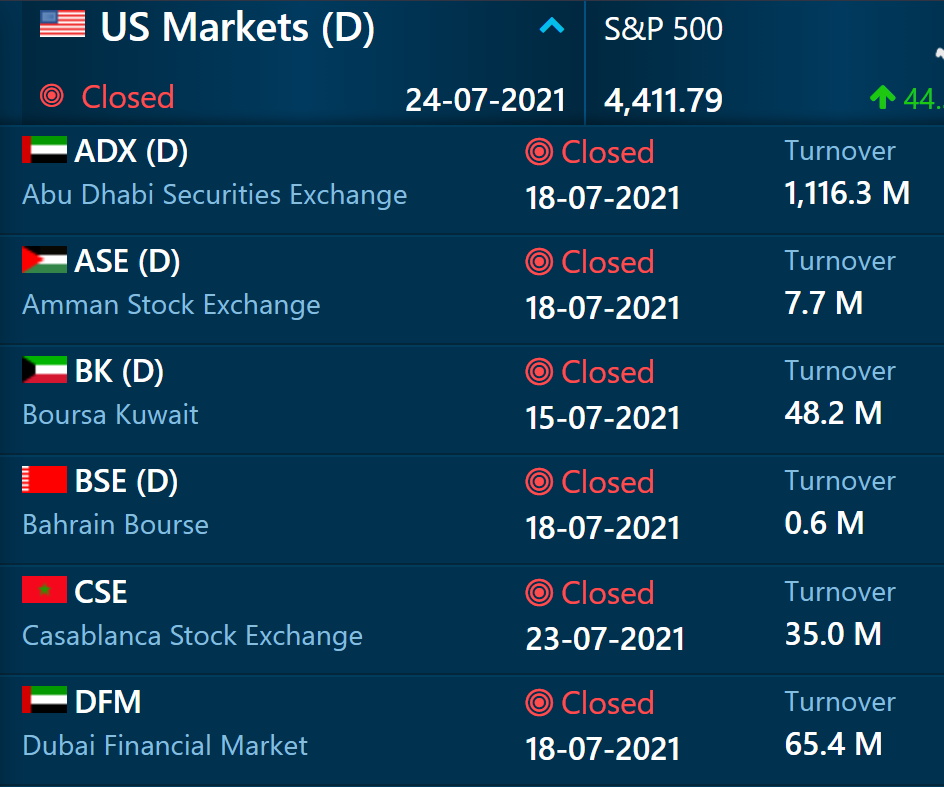
Regional markets - Top Panel

- The cards to the right of the market status card display the selected market index for the selected market, followed by some aggregate measures of market performance (i.e. Turnover, Volume, Trades, Up/ Unchanged/ Down).
- The 'Buying Power' card to the corner of the top panel represents the amount of cash available (within the user's portfolio) to buy stocks with.
- The associated portfolio can be changed using the dropdown in the buying power card.
- Purchased stocks and the cash available in a particular currency are grouped into 'Portfolios' within the app. When a user buys a stock, it is added to a portfolio, and when a stock is sold, its proceeds (sale amount) are added to the Portfolio's cash balance (i.e. "Buying Power").
- Market Index: The displayed index can be changed using the dropdown located next to the market index column.
- Turnover: This refers to the value of the total number of trades in the selected market within one trading day.
- Volume: refers to the total number of shares that have been traded (bought or sold) within one trading day.
- Trades: This refers to the number of trades/ transactions that took place in the selected market within one trading day.
- Up/ Unchanged/ Down: This bar chart represents the number of symbols (of those traded within the day) that are Up, Unchanged, or Down within the selected market.
- For instance, at the time the above image was taken, of the symbols traded in the Dubai Financial Market, 16 symbols were Up, 6 remained Unchanged, and 9 were Down (compared to the previous trading day).
- 52-Week High/ Low: This is a popular stock metric that illustrates the highest or lowest point of a stock's price within a 52-week time window.
4. Watchlist Market Selector
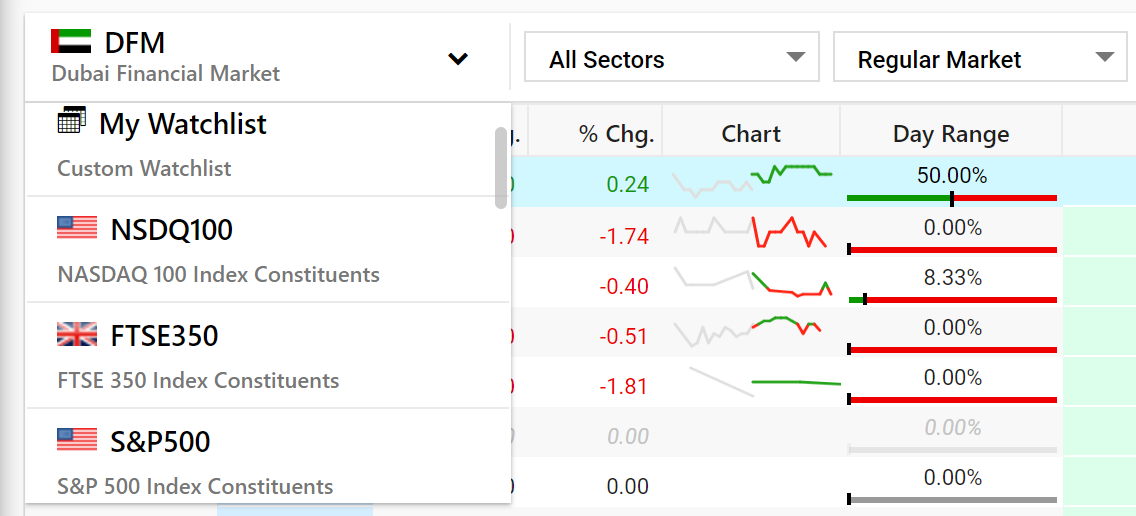
- The watchlist selector dropdown is located within the watchlist widget/ frame below the top panel and can be used to view the complete list of symbols in a particular market/ exchange (i.e. DFM, NYSE, etc.) or a user-created watchlist.
- Some market/exchange watchlists can be filtered by the sub-markets or sectors. I.e. in the event, the selected exchange contains multiple sub-markets or industrial sectors.
- For instance, selecting the Dubai Financial Market (DFM) from the watchlist dropdown will display the constituent symbols for DFM's Regular, Futures, or Options market (this sub-market can be changed from the sector dropdown alongside the main watchlist dropdown).
- Depending on your subscription the market feed can be a Real-time feed or a Delayed feed (this changes how fast information is updated). A delayed view is indicated by a "D" next to the market name in the market selector dropdown.
- Real-time: This refers to live (as it happens) updates from the exchange.
- Delayed: The trading events and updates to various fields (such as market time and sales, trades, and volume, etc.) are delayed by a predefined interval.
5. Search
- The application includes a powerful search function that lets you search for any symbol, index, currency, or financial security (options, futures, ETFs, etc.).
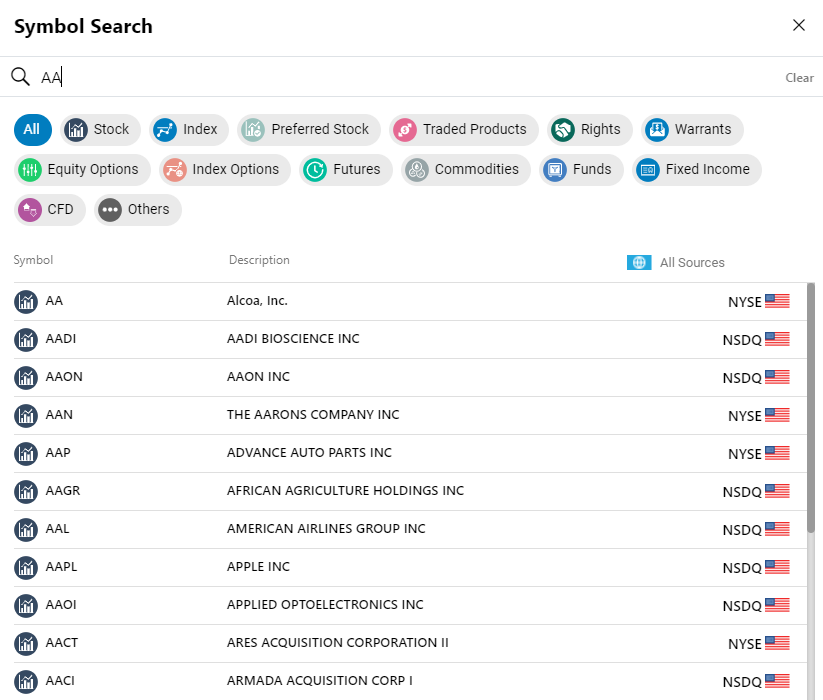
- Simply click on the search icon
 and start typing the name of stock/ security you wish to view, then select it from the relevant category when displayed in the autocomplete list.
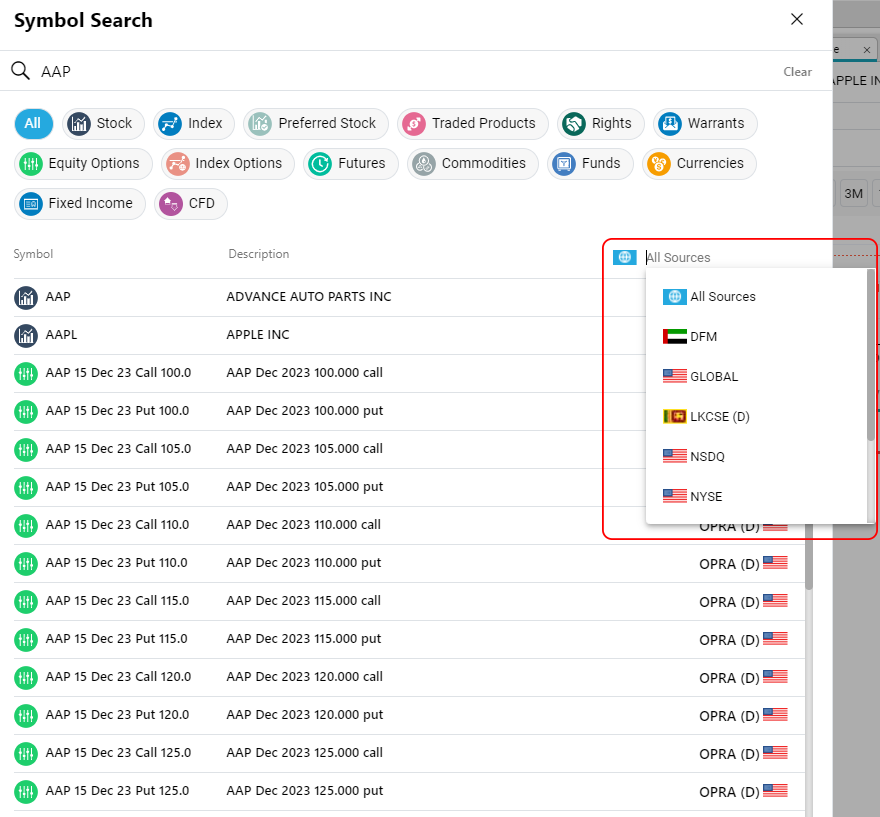
- You can filter the search results by Stock, Equity Options, Traded Products, Commodities, Currencies, Fixed Income, Money Market, Option on Equity Future, Warrants, CFD.
- The search results can be filtered based on the exchange. Click on All Sources and select the desired exchange.
6. Logout
- Click on the power icon located at the right-hand corner of the screen if you wish to log out from the application. The system will open a confirmation prompt, click on 'Yes' to log out, or 'No' to stay logged in.
7. Stock Summary widget
- A summarized stock profile of the symbol that is selected in the watchlist widget will be displayed in this panel.
- For instance, in the following (pictured) example, NFLX is selected from the Nasdaq100 market on the left, and the stock profile for NFLX (Netflix) is displayed to the right of the watchlist widget.
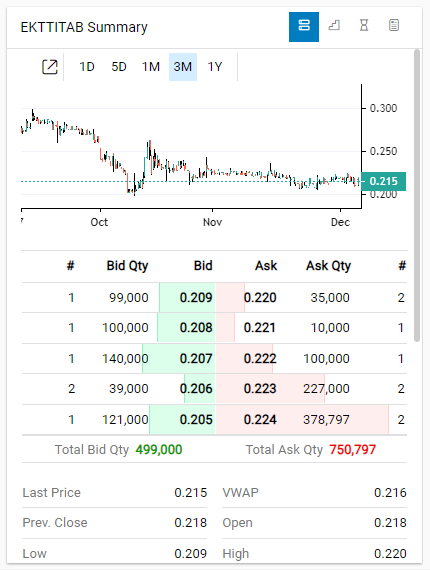
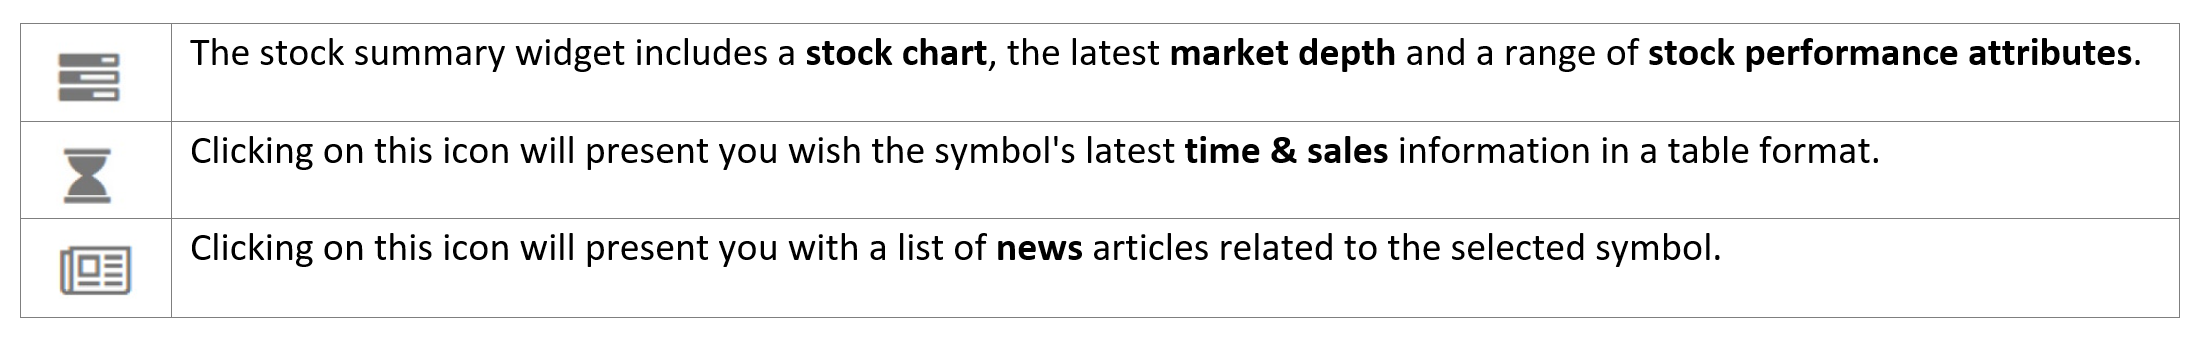
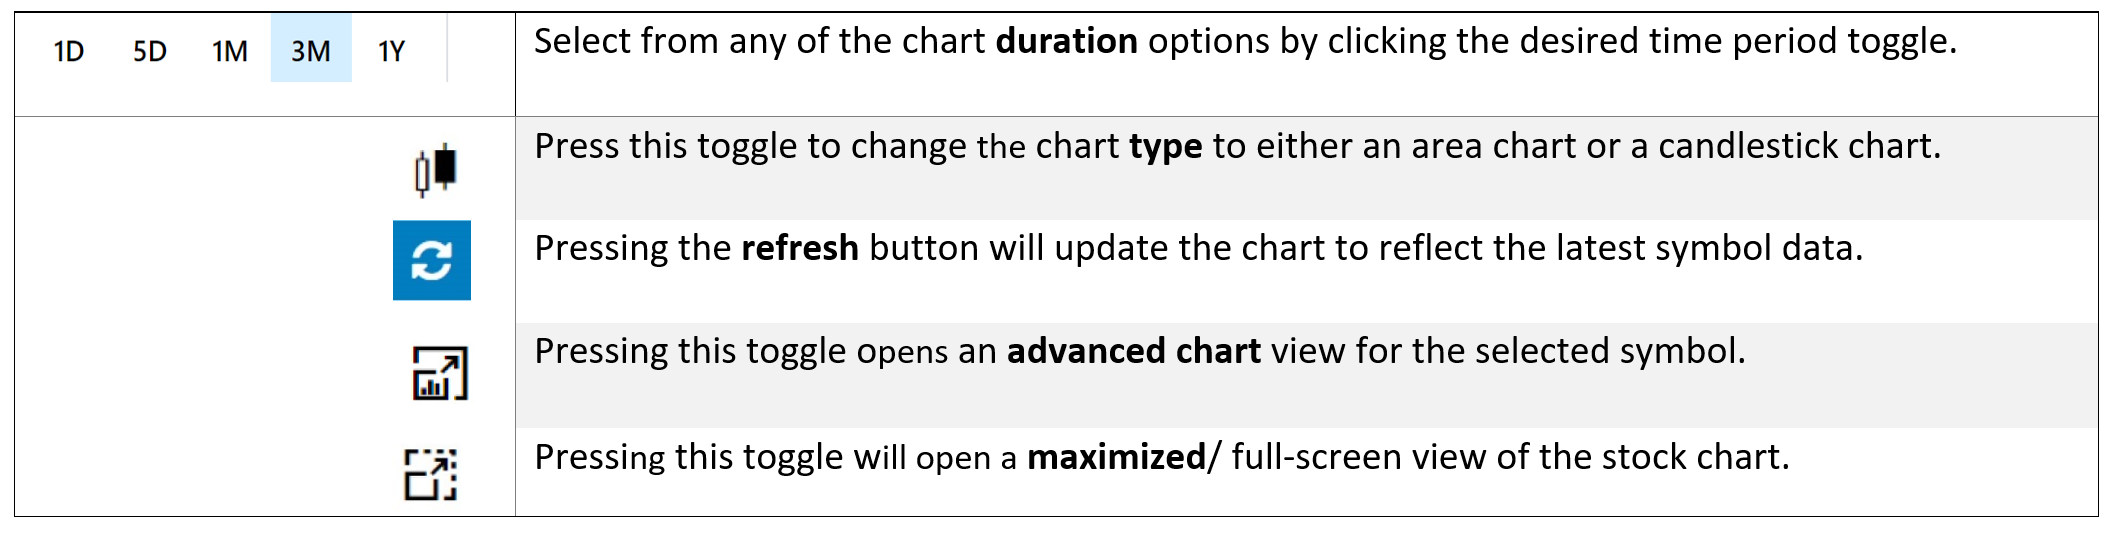
- Stock chart options within the stock summary widget:
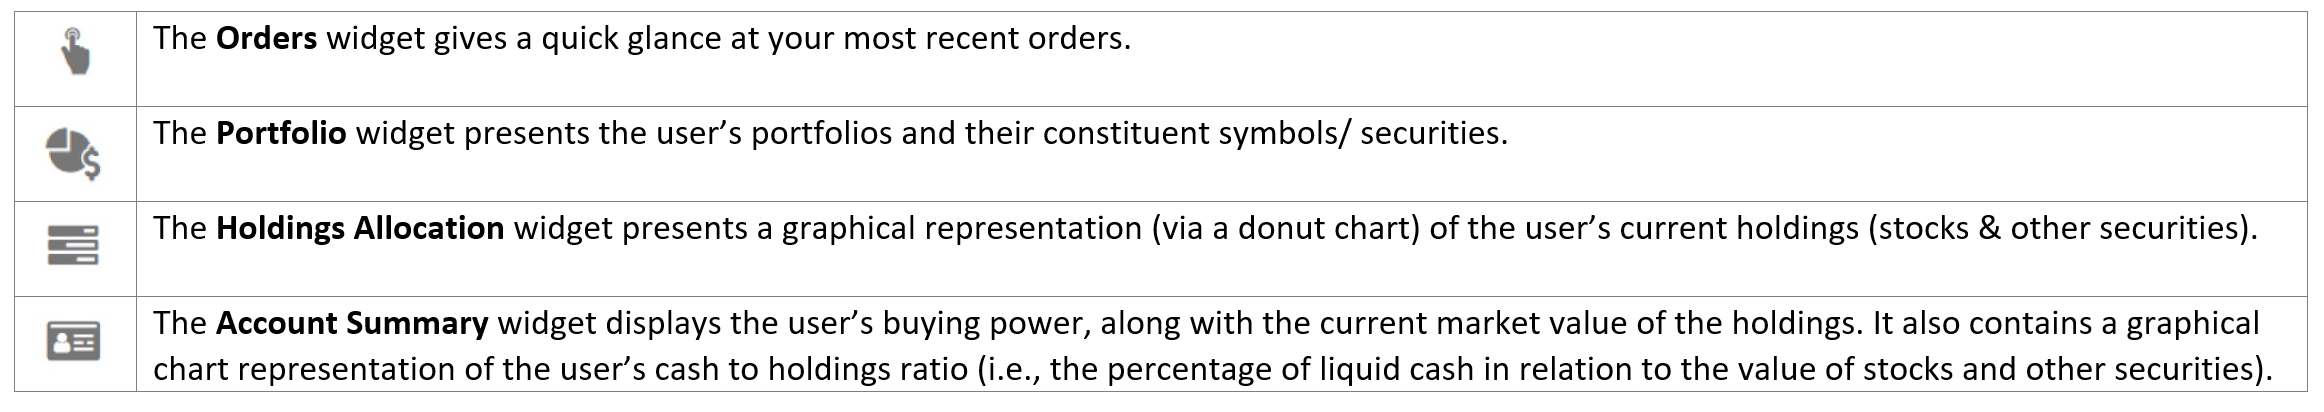
8. Order List widget
- This widget contains access to the following elements that provide a quick glance at the user's orders, their portfolio, and their performance attributes.
- The order ticket serves as the core component through which you can buy / sell stocks using the application.
- Clicking on the 'Advanced' button will open a full Order Ticket enabling you to customize a wider range of fields.
- Clicking on a symbol within the watchlist widget will automatically populate the order ticket widget with the symbol name, price, and other details enabling you to place a buy or sell-side order with ease.
- Selecting an option from the 'Action' dropdown (i.e. buy, sell, sell short, buy to cover), will change the color scheme of the order ticket, and update the relevant fields within it (i.e. Clicking on a symbol already purchased and selecting the 'Sell' action would automatically indicate the existing Holdings or quantity of the stock already available in the user's portfolio).
10. Minimize Side Menu
- Clicking on this icon will minimize the side menu, thus expanding the workspace area.
11. Send Inquiry
- This feature allows you to contact the support and technical teams relating to a general concern, to report a bug or an issue experienced, or to issue a succession.
12. Settings
- Click on the icon to access the application's settings, which lets you customize the look and feel as well as the functionality of several components within the app.
13. About Us
- Clicking on this icon will open up a window displaying the contact details of the company along with the End User Agreement and the application version number.
14. Help Guide
- Clicking on this icon will redirect to the help guide for the application.
15. Connection Status
- This icon displays your connection status to the trading application. This can be an 'Online', 'Partially Connected', or 'Offline' status.
16. Version number
- This refers to the application's version number. This is subject to change based on system updates.
Refer to the section on Keyboard Shortcuts to learn more about accessing key features through shortcut keys.